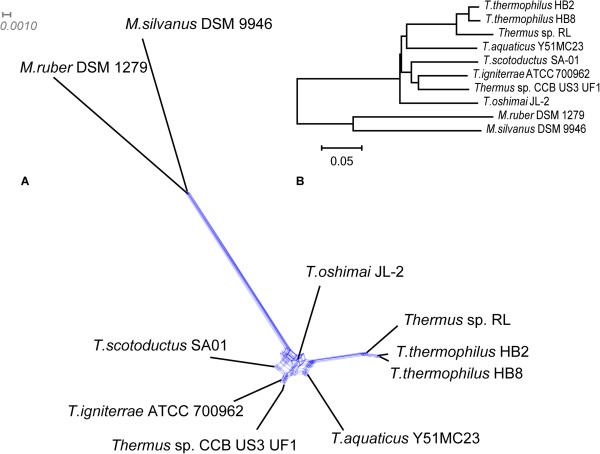
Figure 2.

Phylogenetic relationships between studied organisms. A) Reticulation network created based on an analysis of individual gene trees by SplitsTree. Blue lines indicate possible gene exchange events between species. B) Neighbour-Joining phylogenetic tree based on a super-alignment of 1,441 orthologous proteins.
