
Figure 3.
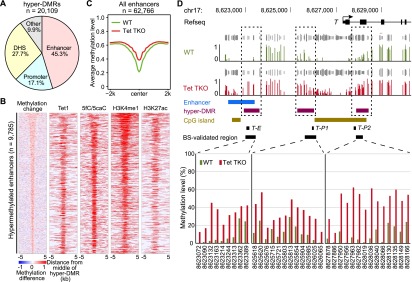
Enhancers are the main targets of Tet-mediated DNA demethylation. (A) Pie chart distribution of hyper-DMRs in Tet TKO mESCs. Hyper-DMRs were mainly localized to enhancers, promoters, and other DHSs (defined by at least 1 bp overlap). For regions belonging to more than one category, the classification follows the priority of enhancer, promoter, and DHSs. (B) Heat maps of methylation difference; peak regions of Tet1 binding, 5fC/5caC in TDG knockdown cells, H3K4me1, and H3K27ac at hypermethylated enhancers in Tet TKO cells. Heat maps are ranked by the size of hyper-DMRs that overlap with enhancers (top, largest; bottom, smallest). Each row represents one enhancer that overlaps with a hyper-DMR in Tet TKO cells and is centered at the midpoint of the enhancer with a 5-kb flanking sequence. In the methylation change column, the colors in the legend indicate the value of the methylation difference. In the other columns, the colored regions indicate peaks of the selected features. (C) Plot of the average methylation level at all annotated enhancers showing general hypermethylation at enhancers in Tet TKO ESCs. (D) Representative genome browser view of hypermethylation of the T locus. Both the enhancer and the promoter of T were hypermethylated in Tet TKO mESCs. Track information is shown on the left side of each track. Gray tracks above DNA methylation tracks are sequencing coverage data (CpGs covered for at least 5× in both control and TKO samples). T-E, T-P1, and T-P2 indicate regions analyzed in Supplemental Figure 7. Targeted bisulfite sequencing validation is shown at the bottom. The X-axis numbers indicate position of CpG sites in mm9 genome assembly. The CpGs were covered at least 1750×.