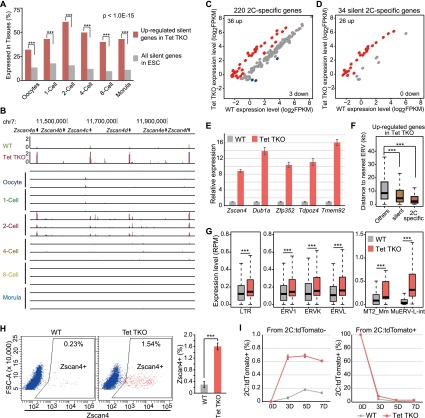
Figure 5.
2C-specific genes are up-regulated, and the 2C-like population is increased in Tet TKO ESCs. (A) Silent genes up-regulated in Tet TKO ESCs were enriched in oocytes and all stages of preimplantation development. The percentage of up-regulated silent genes in Tet TKO cells and all silent genes expressed at a given developmental stage is shown. Statistical significance was performed by proportion test. (B) Zscan4 cluster is shown as an example of 2C-specific genes up-regulated in Tet TKO ESCs. Bar, 50 kb. (Top) RNA-seq results of wild-type (WT) and Tet TKO ESCs. (Bottom) RNA-seq results of mouse oocytes and embryos at different stages of preimplantation development. (C,D) Scatter plot illustrating the enrichment of increased expression of 2C-specific genes (C) and silent 2C-specific genes (D) in Tet TKO ESCs. Up-regulated genes and down-regulated genes are shown as red and blue dots, respectively. The number of up-regulated genes and down-regulated genes is shown at the top left and bottom right, respectively. (E) Activation of 2C-specific genes validated by RT-qPCR. Actb was used as internal control for expression analysis. Error bars represent standard error of the mean. (F) Up-regulated 2C-specific genes in Tet TKO ESCs were closer to ERVs. The average distance between TSSs and ERVs was plotted for different categories of genes. Statistical significance was calculated by Wilcoxon test; (***) P-value < 0.001. (G) Derepression of ERVs, especially type III Mu-ERVLs in Tet TKO ESCs. The expression of the LTRs of all ERVs, the three subtypes of ERV (ERV1, ERVK and ERVL), and two subregions of MuERV-L (MT2_Mm and MuERV-L-int) in wild-type and Tet TKO ESCs is shown in the box plot. Statistical significance was calculated by Wilcoxon test; (***) P-value < 0.001. (H) Tet TKO resulted in an increase in the Zscan4-positive 2C-like cell population. Zscan4 staining analyzed by FACS is shown in the scatter plot. Approximately 20,000 cells were counted for each experiment. The bar graph on the right shows average data from three experiments. Error bars represent standard deviation. (I) Plot of 2C:tdTomato-positive cells in the culture at the indicated times. 2C:tdTomato-negative cells (left) and 2C:tdTomato-positive cells (right) sorted by FACS were plated at day 0. Error bars represent standard deviation.

