Figure 6.
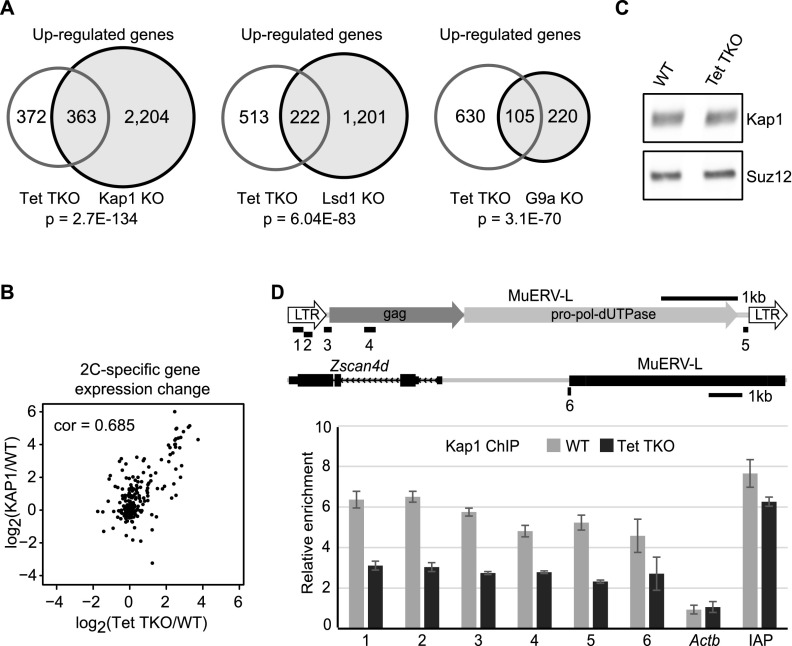
Tet proteins repress 2C-specific genes and LTRs by facilitating Kap1 recruitment. (A) Venn diagram showing that genes up-regulated in Tet TKO ESCs significantly overlap with those up-regulated in Kap1, Lsd1, or G9a knockout (KO) ESCs. (B) Scatter plot showing strong expression correlation of the 220 2C-specific genes in Tet TKO and Kap1 knockout ESCs. (cor) Pearson coefficiency. (C) Western blot analysis demonstrated that the Kap1 protein level was not significantly altered in Tet TKO ESCs. Suz12 served as a loading control. (D) ChIP analysis demonstrated reduced KAP1 binding at MuERV-L elements in Tet TKO ESCs. The relative enrichment is fold enrichment of relative DNA captured by Kap1 antibody compared with DNA captured by IgG control. ChIP-qPCR-analyzed genomic regions are indicated in the diagram in the top panel. One-kilobase scale bars are shown for each of the two loci. Amplicons 1–5 are within MuERV-L repeats. Amplicon 6 is a single-copy region that partly overlaps with the MuERV-L repeat upstream of Zscan4d. Amplicon IAP is one region in the LTR of the IAP elements. The promoter region of Actb was used as a negative control. Error bars represent standard error of the mean.

