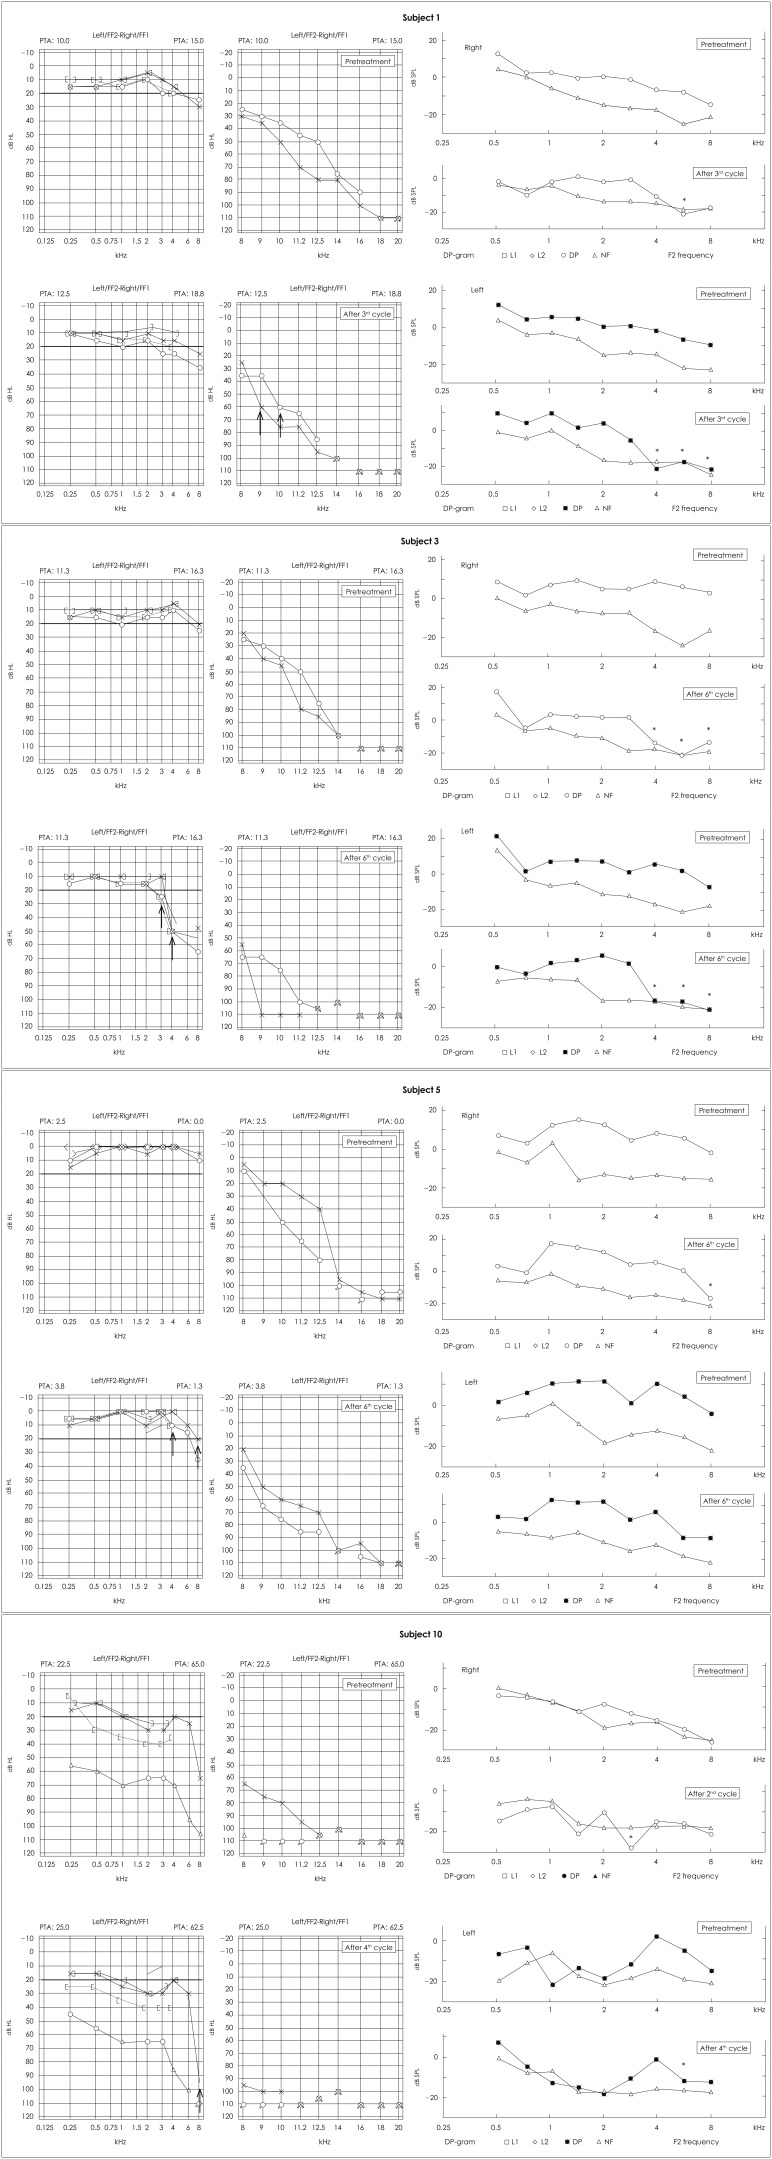
Fig. 1.
Results of pre-treatment and post-treatment EHF-PTA and DP-OAE for patients with hearing impairment. Two left audiograms show pre-treatment and post-treatment EHF-PTA in both ears, and four right DP grams show pre-treatment and post-treatment DP-OAE of right and left ears. ↑lowest frequency that showed threshold change (kHz). *frequencies that showed DP-OAE value change (kHz). EHF-PTA: extended high-frequency pure-tone audiometry, DP-OAE: distortion-product otoacoustic emission, NF: noise floor.

