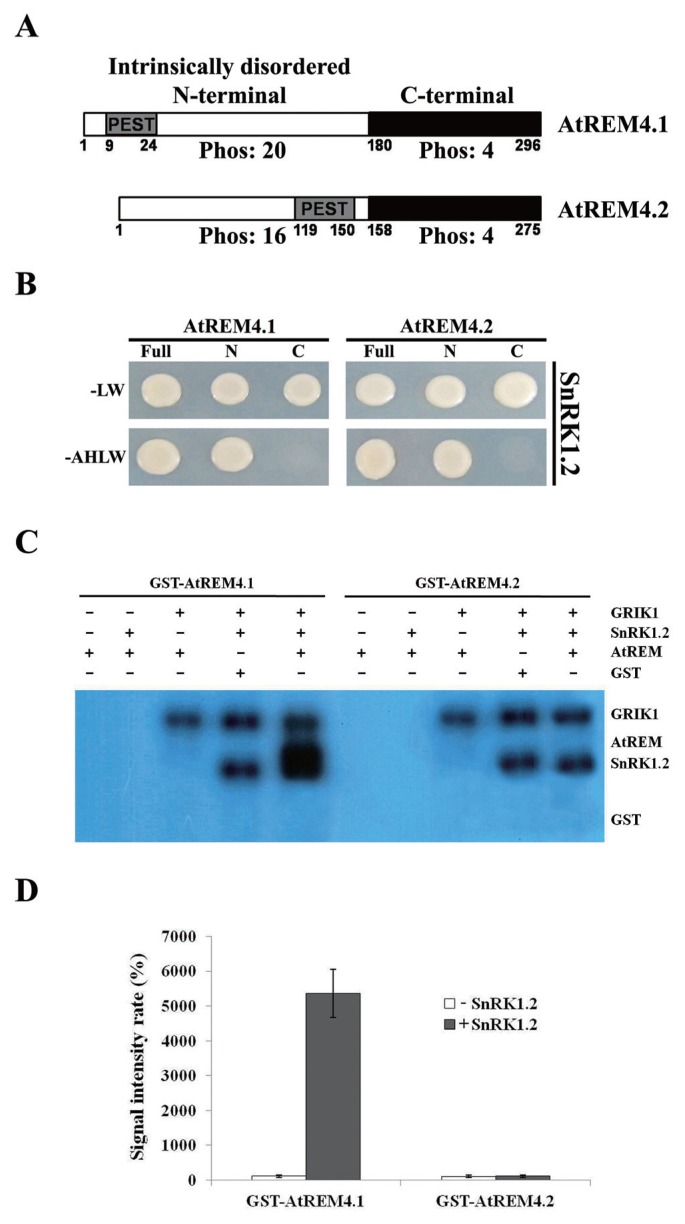
Fig. 4.
Phosphorylation of AtREM4s by SnRK1.2 in vitro. (A) Schematic representation of AtREM4 domains. Putative PEST domain and phosphorylation site numbers are shown. Numbers indicate amino acid positions. (B) Y2H analysis to determine interacting domains of AtREM4s with SnRK1. Constructs of full length and truncated N and C-terminal ends of AtREM4s were used. (C) In vitro kinase assay for recombinant proteins of AtREM4s, SnRK1.2 and GRIK1. The reactions were resolved by SDS-PAGE gel and visualized by autoradiography. (D) Quantification analysis for the band signal intensity was measured by ImageJ, and the signal intensity rates were calculated such as (GST-AtREM4 intensity/GST intensity) × 100.

