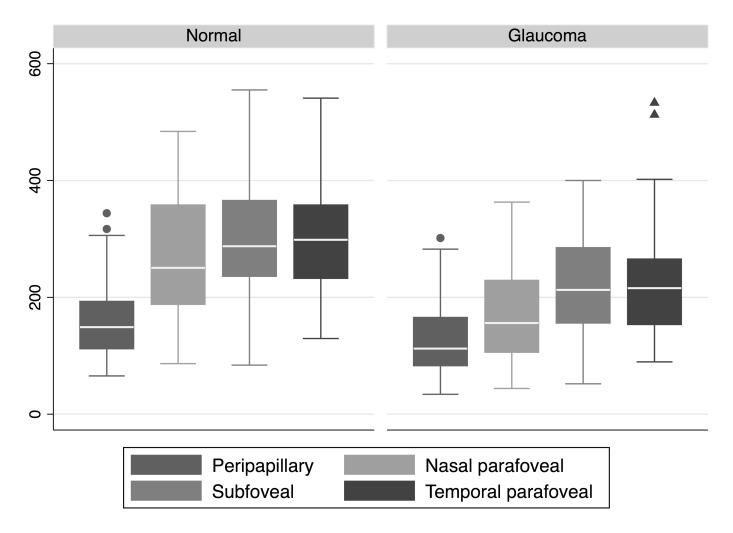
Figure 2.
Distribution of choroidal thickness at 4 selected locations on the 9 mm HD5 OCT scan according to diagnosis. Central line in the box = median, borders of the box = interquartile range, and whiskers = 95% confidence intervals, circles or triangles = outliers. HD, high definition; OCT, optical coherence tomography

