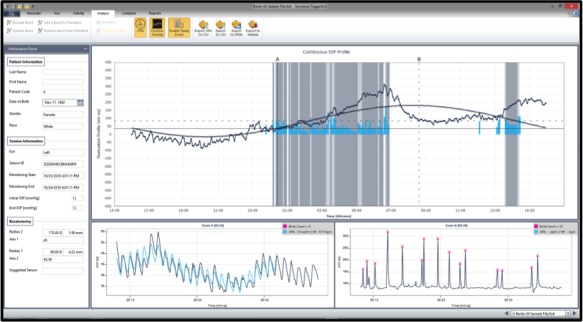
Figure 2.

Example of 24-hour intraocular pressure monitoring with the contact lens sensor. Scales on the y-axis correspond to electric voltage changes in mVolts. The software provides automated analysis of acrophase (peak signal) and amplitude using cosinor rhythmometry. The blink detection software can be used to evaluate sleep times.
