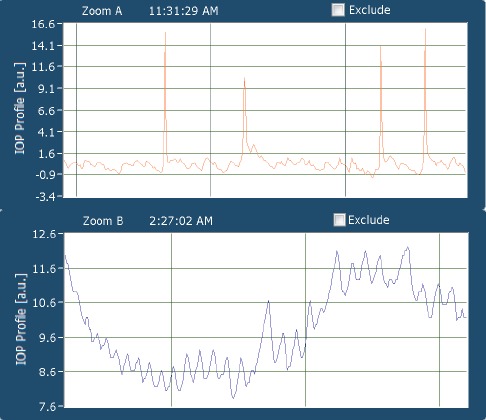
Figure 3.

Detailed view of a 30 second window: the patient is awake, the large spikes correspond to effect of eye blinks on contact lens sensor output. Smaller changes correspond to ocular pulsations (top image). The patient is asleep, as evident through an absence of eye blinks. The software automatically adjusts the scale of the y-axis to smaller changes, which correspond to ocular pulsations (bottom image).
