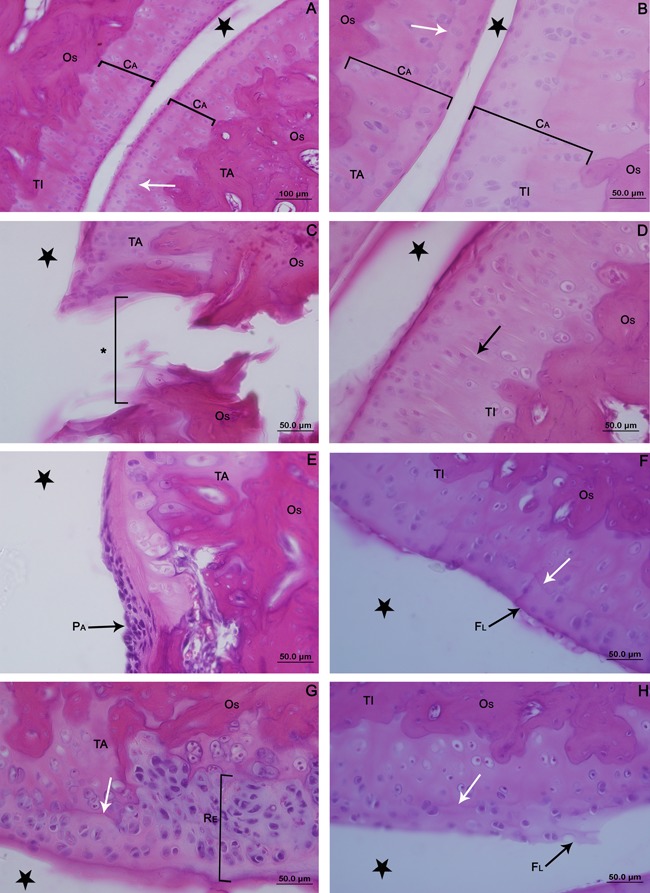
Figure 2. Photomicrographs of the articular cartilage of the ankle joint of the control contralateral hindlimb of Wistar rats (A and B); G1 (C and D); G2 (E and F); G3 (G and H). Sagittal section, hematoxylin and eosin staining. A, Panoramic view showing the articular cartilage (CA). B, Details of cellular organization. C, Loss of cartilage (asterisk) with exposed subchondral bone (OS). D, Cracks (black arrow). E, Pannus formation (PA). F, Presence of flocculation on the surface of cartilage (FL). G, Recovery of articular cartilage with the presence of clones (RE). H, Flocculation on the surface. Articular cavity (star), tidemark (white arrow), talus bone (TA) and tibia (TI). G1: immobilized; G2: remobilized freely for 14 days; G3: remobilized by swimming and jumping in water for 14 days.

