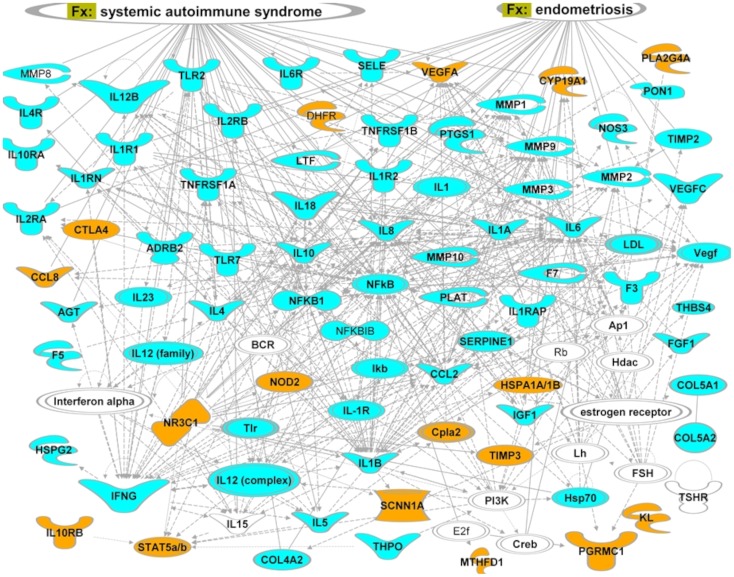
Figure 2. Top ranked gene network reconstructed from genes associated with sPTB (blue and orange blocks).
Genes unique for the African American dataset, not studied in relation to pPROM condition are shown in orange. Links projected from ‘Functions and diseases’ (Fx) categories of IPA’s knowledge database are shown in oval shapes at the top of the figure. Lines correspond to functional (arrows) or physical interactions (lines) between proteins. An arrow indicates a regulatory vector. Solid lines imply direct relationships between proteins, dotted lines imply indirect interactions. Relationships include post-translational modifications, transcription regulation, proteolysis or co-expression. Different node shapes represent the following: complexes or unknown (NfkB), cytokines and growth factors (IL8), enzymes (DHFR), peptidases (MMP1), transcription regulators (NFKB1), nuclear receptors (NR3C1), channels (SCNN1A).

