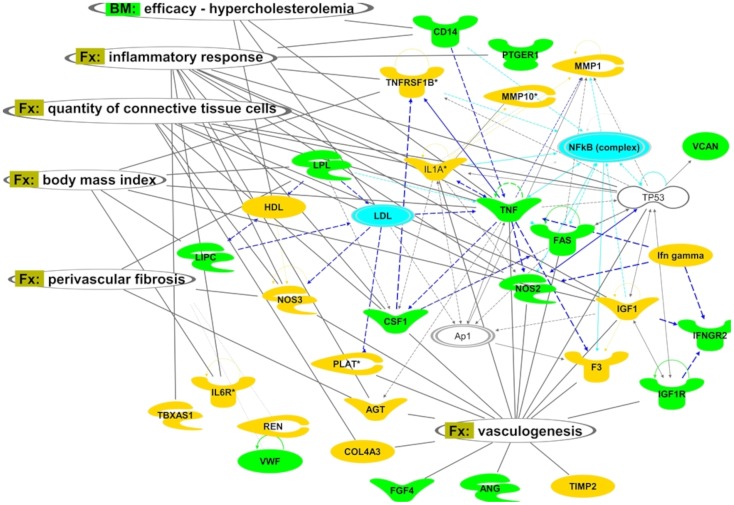
Figure 3. Top ranked gene network reconstructed from genes associated with PPROM (green and blue blocks).
Green color represents pPROM specific functions, blue- genes associated with both sPTB and pPROM and yellow-functions specific for sPTB. Ovals- links projected from ‘Functions and diseases’ (Fx) and ‘Biomarkers’ (Bm) categories of IPA’s knowledge database. Lines correspond to functional (arrows) or physical interactions (lines) between proteins. An arrow indicates a regulatory vector. Solid lines imply direct relationships between proteins, dotted lines imply indirect interactions. Relationships include post-translational modifications, transcription regulation, proteolysis or co-expression. The blue lines indicate the NfkB area of influence. Different node shapes represent the following: complexes or unknown (an example is NfkB), cytokines and growth factors (as for CSF1), enzymes (NOS3), peptidases (MMP1), transcription regulators (TP53).

