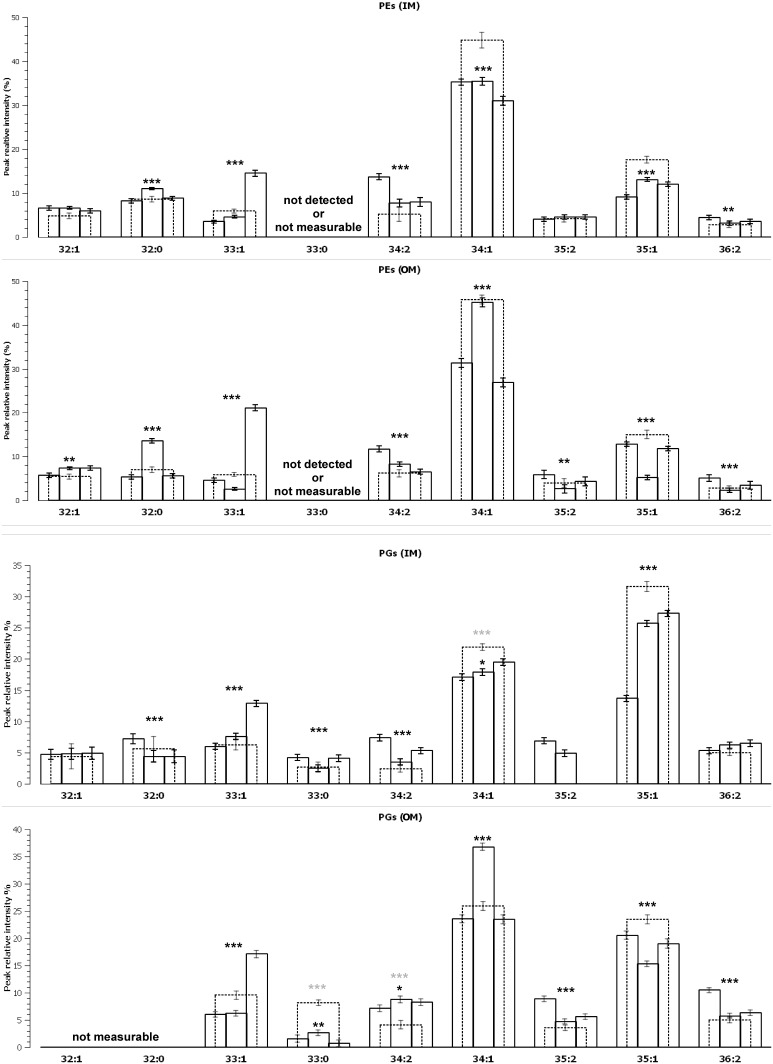
Figure 2. Evolution of the proportions of the main phosphatidyletnolamines and phosphatidylglycerols in P. aeruginosa inner and outer membranes.
The proportions obtained for planktonic bacteria is represented in dashed lines. Error bars are given with a 95% confidence interval. Results of ANOVA test for the phospholipid proportions in sessile bacteria are shown (***, p-value<0,001; **, p-value<0,01; *, p-value<0,1 none p-value>0,1 (not statically relevant)). When different results of ANOVA test including the phospholipid proportions from planktonic bacteria are shown in grey.

