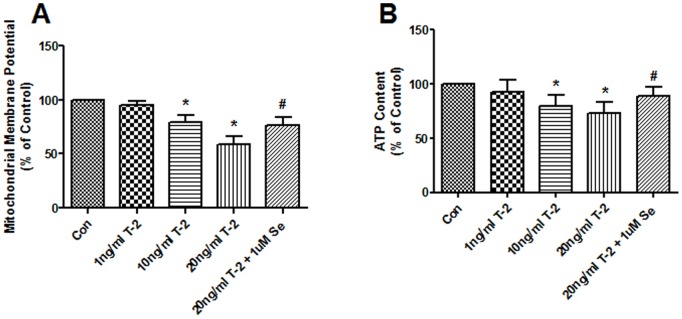
Figure 2. Effects of T-2 toxin on the mitochondrial membrane potential and ATP.

A. Normal human chondrocytes were exposed to 1 10, 20 ng/ml T-2 toxin and 1 uM Na2SeO3+20 ng/ml T-2 toxin for 5 d. The mitochondrial membrane potential of chondrocytes was analyzed using the fluorescent dye JC-1, and quantified by a flow cytometer. B. Effect of different concentrations of T-2 toxin on the cellular ATP. *P<0.01 vs. control; #P<0.01 vs. 20 ng/ml T-2 toxin group.
