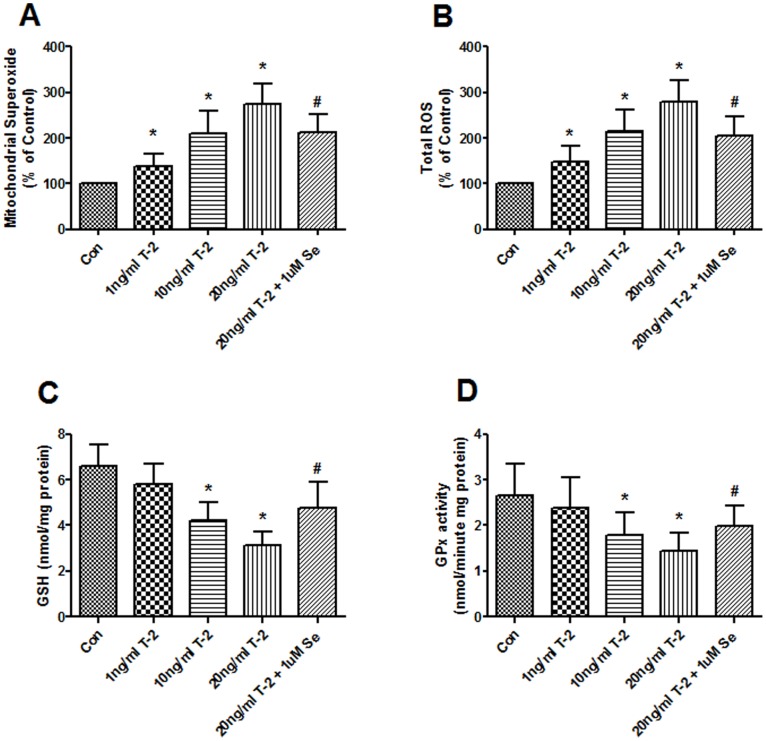
Figure 3. Effects of T-2 toxin on ROS and antioxidants generation.
The production of ROS at mitochondrial (A) and cytoplasmic (B) level was assessed by MitoSOX red mitochondrial superoxide indicator and Carboxy-H2DCFDA probe (both from Invitrogen), respectively. GSH concentration (C) and GPx activity (D) were measured by coupled enzyme assay as described under “Materials and methods”. Chondrocytes were incubated with1, 10, 20 ng/ml T-2 toxin and 1 uM Na2SeO3+20 ng/ml T-2 toxin for 5 d. *P<0.01 vs. control; #P<0.01 vs. 20 ng/ml T-2 toxin group.

