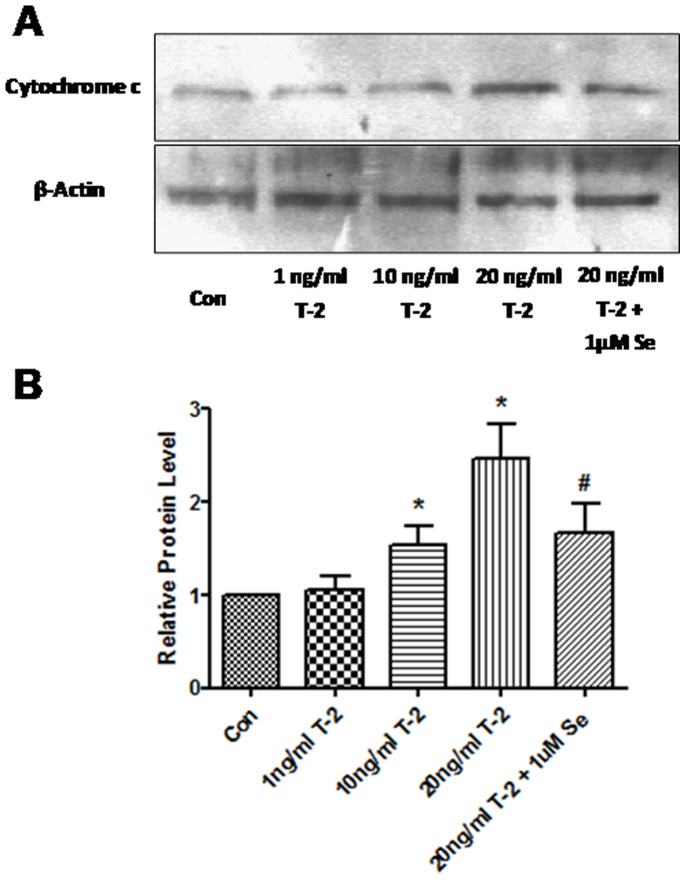
Figure 4. Western blot analysis for cytochrome c protein in normal human chondrocytes after treatment with 1, 10, 20 ng/ml T-2 toxin and 1 uM Na2SeO3+20 ng/ml T-2 toxin for 5 d.
A. Western blot of cytochrome c. B. Increase of cytochrome c relative to control. Data are shown as the mean ± S.D. of at least three separate experiments. *P<0.01 vs. control; #P<0.01 vs. 20 ng/ml T-2 toxin group.

