
Figure 3.
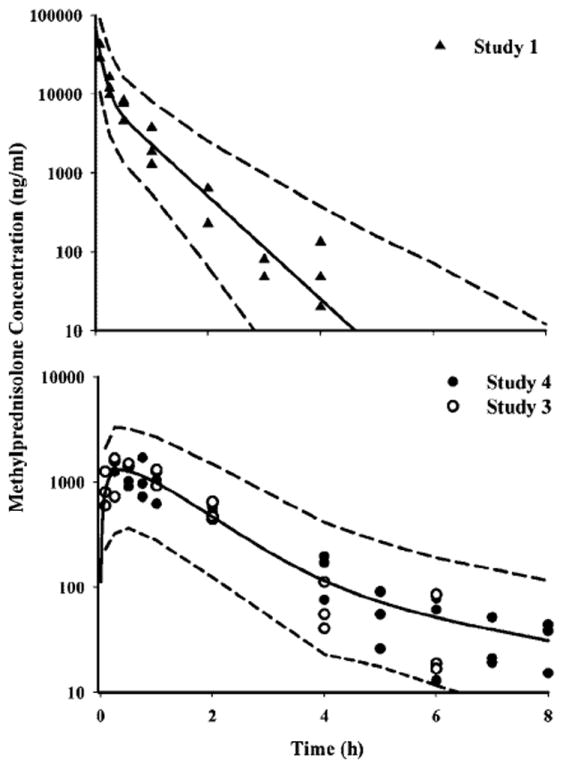
Pharmacokinetic profiles of MPL after i.v. (top panel) and i.m. (bottom panel) administration. Symbols depict the observed data, solid lines represent the mean predictions, and the dashed lines reflect the 95% CI of the predictions
Official websites use .gov
A
.gov website belongs to an official
government organization in the United States.
Secure .gov websites use HTTPS
A lock (
) or https:// means you've safely
connected to the .gov website. Share sensitive
information only on official, secure websites.
Pharmacokinetic profiles of MPL after i.v. (top panel) and i.m. (bottom panel) administration. Symbols depict the observed data, solid lines represent the mean predictions, and the dashed lines reflect the 95% CI of the predictions