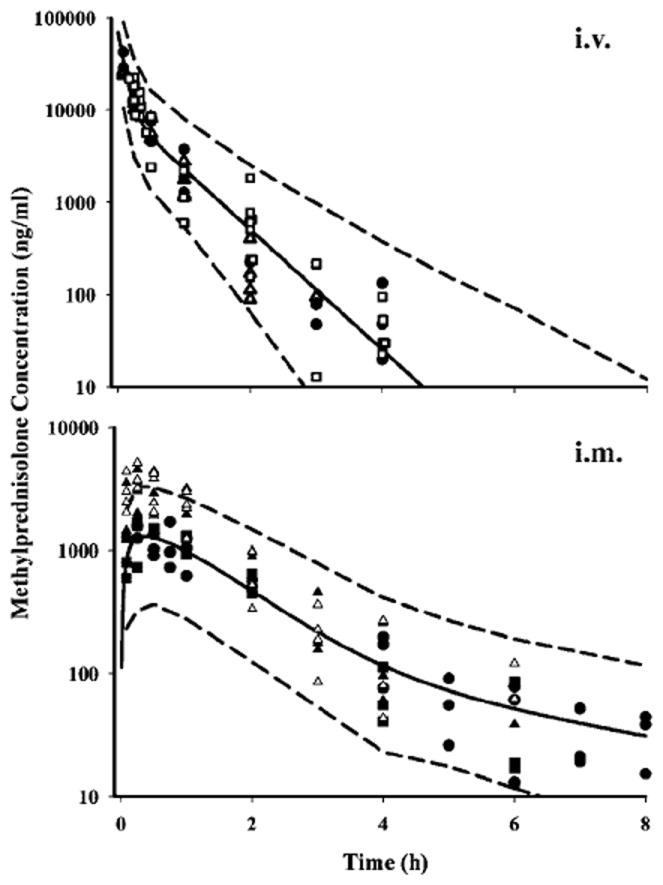
Figure 5.

Simulated (based on model in Figure 1) pharmacokinetic profiles of MPL after i.v. (● Study 1-normal, Δ Study 1-ADX, □ data from Sun et al. [19]) and i.m. (Δ Study 1-normal, ▲ Study 1-ADX, ■ Study 2, ● Study 4) administration. Symbols depict the observed data ± SD, solid lines represent the mean prediction and the dashed lines reflect the 95% CI of 51 the predictions
