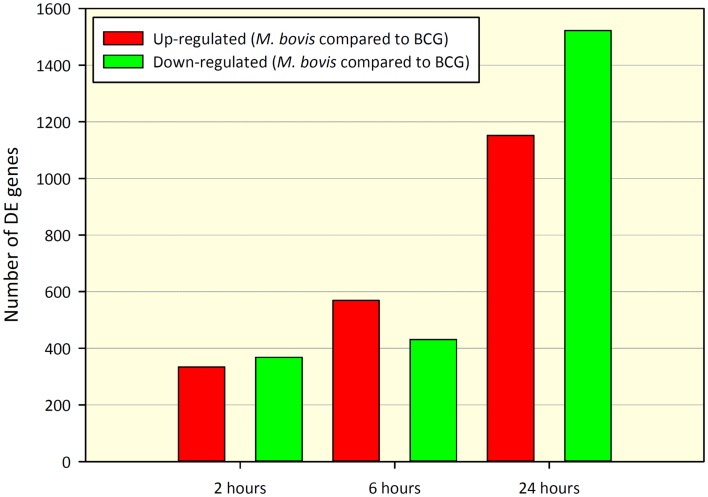
Figure 1.
Number of DE genes found for a paired comparison of virulent M. bovis versus attenuated BCG infections of bovine MDM (n = 7) across a time course of 2, 6, and 24 h post-infection. DE gene numbers are reported here after filtering using an adjusted P-value of ≤ 0.01. Red bars indicate the number of genes displaying increased relative expression in M. bovis compared to BCG (up-regulated) and green bars indicate the number of genes displaying decreased relative expression in M. bovis compared to BCG (down-regulated).

