
Fig. 2.
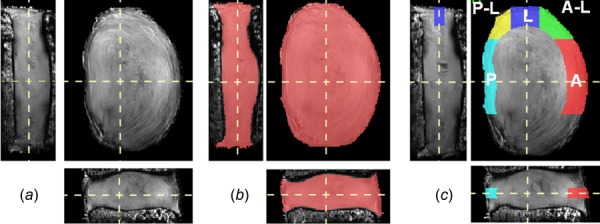
Images ((a)–(c)) are oriented to show coronal (left), axial (top-right), and sagittal (bottom) planes. (a) Representative MRI data set. (b) The volume used for strain analysis (pink). (c) AF regions of interest defined in the midaxial plane: A = anterior (red), A–L = anterior–lateral (green), L = lateral (blue), P–L = posterior–lateral (yellow), P = posterior (aqua).