Fig. 13.

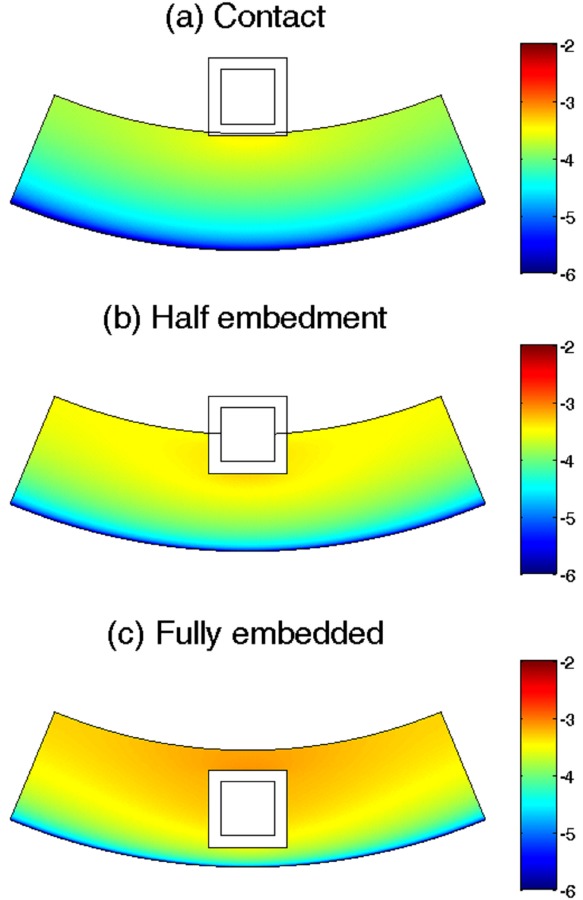
Bound drug distribution in the arterial wall at day 25 for (a) a contacting stent strut, (b) a half-embedded strut, and (c) a fully embedded strut. Color bar is in logarithmic scale (mol/m3). (k i = 0, and v r = 0).

Bound drug distribution in the arterial wall at day 25 for (a) a contacting stent strut, (b) a half-embedded strut, and (c) a fully embedded strut. Color bar is in logarithmic scale (mol/m3). (k i = 0, and v r = 0).