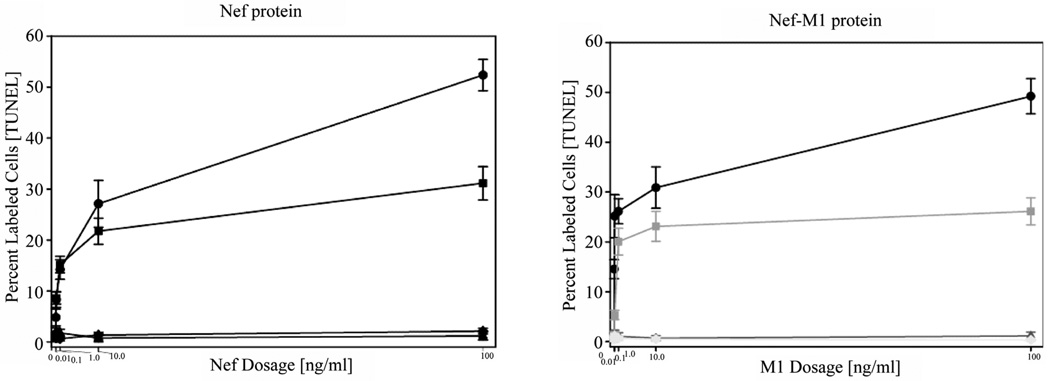
Figure 3.
Nef-M1 peptide dose response as determined by TUNEL assays. Dose responses to the full Nef protein and the Nef-M1 peptide were determined at concentrations of 0, 0.01, 0.1, 1, 10, and 100 ng/ml in CXCR4-negative (MDA-MB468, HME) and -positive (MDA-MB231, MCF7) BC cell lines. The time of exposure was 24 hr. For MDA-MB231 and MCF7 cells, the percent of labeled cells increased with increasing concentrations of the Nef-M1 peptide, whereas there was no change in the percent of labeled cells in MDA-MB468 cells and HME cells. Graph symbols for cell lines: MDA MB231 (circle), MCF7 (square), MDA-MB468 (diamond), HME (triangle).

