
Figure 2.
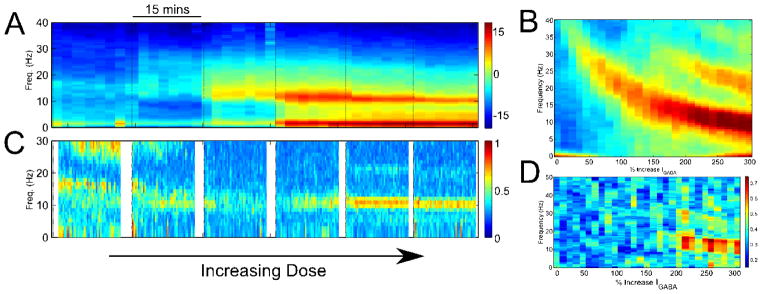
EEG phenomena in the transition from baseline to surgical levels of propofol. (A) Spectrogram of human EEG showing the emergence, sequentially, of diffuse Beta- and narrow Alpha- band oscillations. (B) The output of the thalamocortical model ■[10] matches this phenomenology. The same is true when comparing the EEG coherence between the actual data (C) and model (D). Figure adapted from ■[10].