Figure 5.
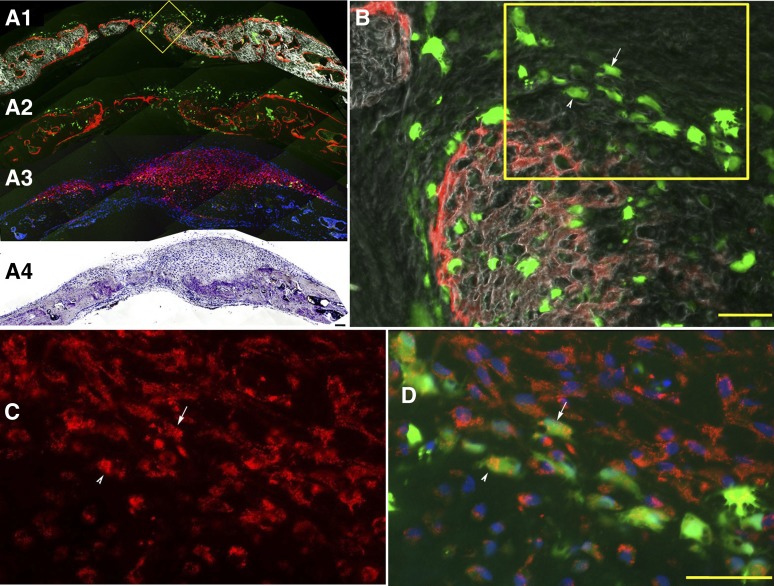
Col2.3GFPemd-positive cells stain with human mitochondrial specific antibody. Cells from the same population of differentiated cells as was used in Figure 4 were implanted in the calvarial defect model. (A): Low magnification imaging. (A1–A3): Dark-field imaging ([A1], white) demonstrated the bone matrix, outlined by the AC labeling ([A1] and [A2], red). Col2.3GFPemd transgene-positive cells were identified by green fluorescence expression (A1–A3). (A3): The same section imaged in (A1) and (A2) was decalcified to remove mineral from the bone matrix and eliminated the AC labeling. Immunohistochemistry was performed with hMit antibody and visualized with Cy3-donkey anti-mouse IgG ([A3], red). Cell nuclei were detected by 4′,6-diamidino-2-phenylindole (DAPI) staining ([A3], blue). (B): Higher magnification image of yellow boxed region in A1. Arrow and arrowhead in (B) point to GFPemd cells that are shown to be hMit-positive in (C) and (D), which are higher magnification image of the yellow boxed region in (B). (C, D): (C) shows only the red signal of hMit antibody staining, whereas (D) is an overlay of green GFP, red hMit antibody staining, and blue DAPI. Scale bar in (B) and (D) = 50 μm.

