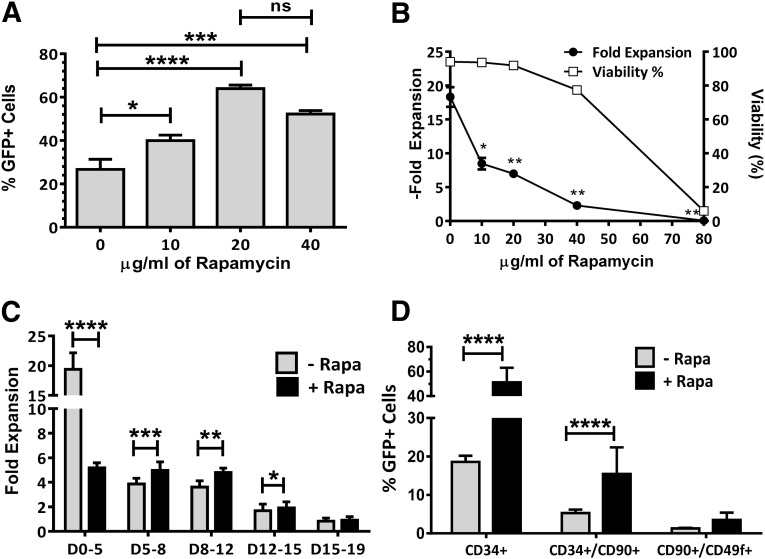
Figure 1.
Rapamycin dose effect on transduction efficiency, cell viability, and cell growth. (A): LV2 transduction of hematopoietic stem and progenitor cells (HSPCs) (percentage of GFP expression) over a range of rapamycin concentrations (n = 3). (B): Cell growth and viability of the same samples shown in (A). (C): Incremental in vitro HPSC proliferation following transduction with or without rapamycin (n = 7). (D): Phenotypic analysis of GFP expression in subpopulations of HSPCs 7 days after transduction in the presence or absence of rapamycin (n = 9 donors for CD34+ and CD34+/CD90+, n = 3 for CD90+/CD49f+). Height of bars represents the average value, and error bars represent SEM. ∗, p < .05; ∗∗, p < .01; ∗∗∗, p < .001; ∗∗∗∗, p < .0001. Abbreviations: D, days; GFP, green fluorescent protein; HSPC, hematopoietic stem-progenitor cells; LV, lentivirus; ns, not significant; Rapa, rapamycin.

