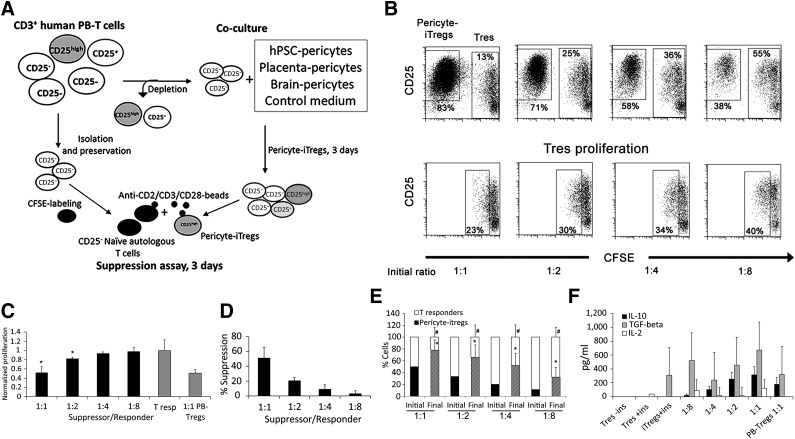
Figure 4.
Pericytes from hPSCs, placenta, and brain induce functional suppressive Tregs. (A): Schematic illustration of experiment. Following depletion of CD3+CD25+ T cells from CD3+ PB T cells, the CD3+CD25− T-cell subset was either incubated with hPSC, brain, or placenta pericytes or preserved for further use as autologous responder T cells. After 3 days in coculture, CD25+ derivatives were isolated and mixed with autologous CD25− T responder cells in the presence or absence of anti-CD2/CD3/CD28 beads during the 3-day suppression assay. (B): Representative dot plots of the frequencies of pericyte-iTregs and CFSE T responders that were mixed at the indicated initial ratios, stained with anti-CD25, and analyzed by flow cytometry. CFSE−CD25high, CFSElow, and CFSEhigh T-cell subsets represent pericyte-iTregs, proliferating T responders, and nonproliferating T responders, respectively (top panel). CFSE+/lowCD25+ cells (bottom panel) represent activated proliferating effector T cells. (C, D): Flow cytometry-based determination T responder proliferation (C) or Treg-mediated suppression (D). Isolated donor-derived PB Tregs were used for positive controls. (E): Proportions of CD25highCFSE− pericyte-iTregs and CFSE+/low T responders at the beginning of the experiment (initial) and after 3 days of stimulation (final). (F): Concentrations of secreted IL-10, TGF-β1, and IL-2 within the indicated conditioned media. (C–F): Data are mean ± SEM of three independent experiments with three different donors with duplicates or triplicates. p < .005 compared with normalized proliferation of T responders (C) and p < .05 compared with initial frequency of T responders (#) and Tregs (∗). Abbreviations: CFSE, carboxyfluorescein succinimidyl ester; IL, interleukin; iTreg, induced regulatory T cell; PB, peripheral blood; TGF, transforming growth factor; Tres, Tresponder.

