Figure 7.
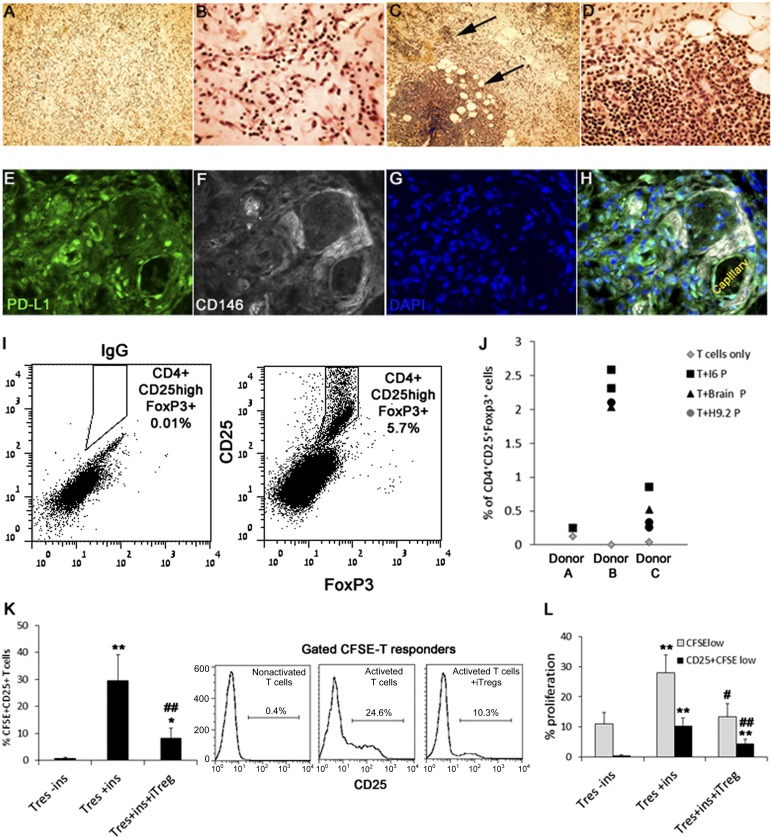
Generation of Tregs in BME implants from CD3+CD25− PB T cells by transplanted pericytes. (A–D): Hematoxylin and eosin staining of 3-day-old BME implants containing isolated CD3+CD25− PB T cells coimplanted with either pericytes (A, B) or PB macrophages (C, D). Clusters of macrophage-activated proliferating T cells are indicted by arrows. Magnification, ×100 (A, C), ×200 (B, D). (E–H): Representative immunofluorescence labeling of H9.2 pericytes mixed with PB T cells in BME implant, PD-L1+ (green, [E]) and CD146+ (white, [F]) are coexpressed by dispersed and capillary surrounding pericytes (H). Nuclear staining by DAPI (blue, [G, H]). (I, J): Pericyte-induced CD4+CD25+FoxP3+ Tregs from the CD4+CD25− subset in BME implants. (I): Gated CD4+ representative dot plots of IgG control (left) and CD25−, FoxP3- labeled cells from 3-day-old mixed implants. (J): Proportions of BME implanted CD4+CD25− T cells, converted into CD4+CD25+ and coexpressing FoxP3, in the presence and absence of pericytes. (K, L): Pericyte iTregs were isolated from implants and mixed with CFSE-labeled T responders at a ratio of 1:1. Matched controls included incubation of CD25−CFSE+ T responders in the presence or absence of suppression reagent (ins). The effect of pericyte-iTregs on stimulation of CD25 expression (K) or proliferation of CFSE-T responders (L) was evaluated by flow cytometry. Data are mean ± SEM of pericyte-iTregs from four pericytic cell lines with T cells from two different donors. ∗, p < .005 and ∗∗, p < .0005 compared with matched population of untreated T responders. #, p < .05 and ##, p < .005 compared with matched population of activated T responders. Abbreviations: CFSE, carboxyfluorescein succinimidyl ester; DAPI, 4′,6-diamidino-2-phenylindole; ins, inspector reagent; iTreg, induced regulatory T cell; P, pericyte; Tres, Tresponder.

