
Figure 2.
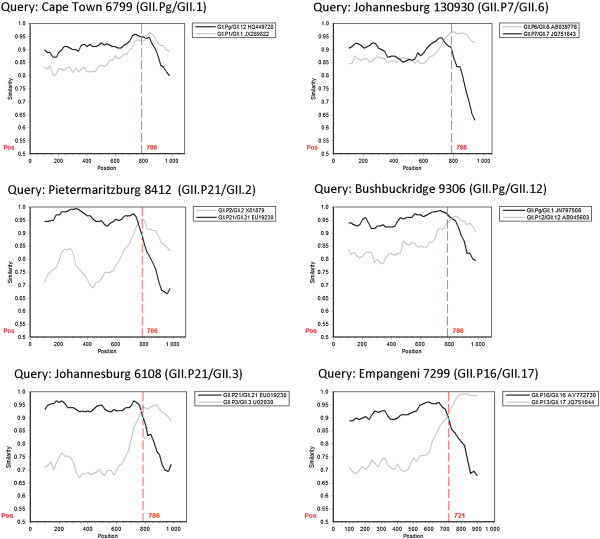
Similarity plots of intergenotype NoV recombinants identified in South Africa. The similarity plots were created with the polymerase/capsid sequence (1010–1090 bp) spanning the ORF1/ORF2 junction using SimPlot version 3.5.1, with a window size of 200 bp and an increment of 20 bp. In each graph, the black and grey lines represent the percentage identity of the putative parental strains to each respective recombinant. The start of ORF2 is indicated by the dashed red line (position 721 or 786). The predicted recombination breakpoint is where the parental strains share equal identity to the recombinant strain.