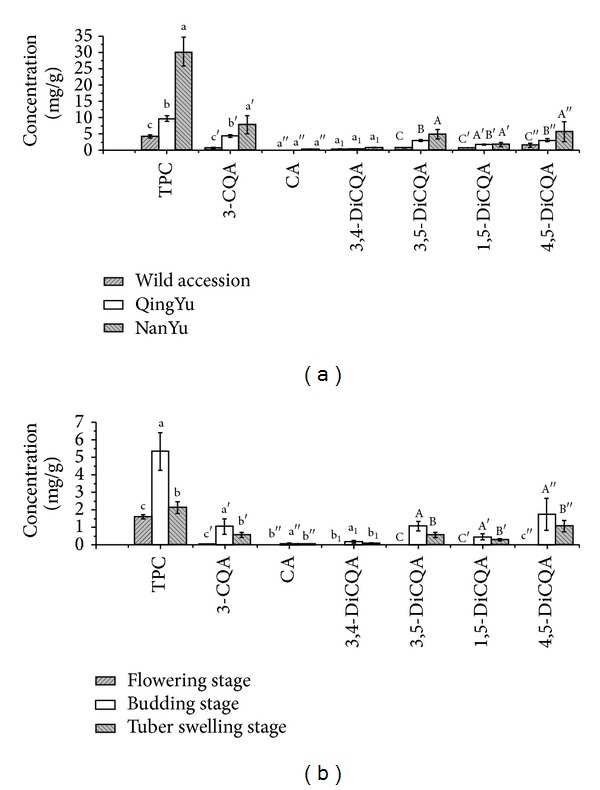
Figure 3.

Concentration of phenolics in H. tuberosus leaves of different genotypes: (a) in 2011 and growth stages of cultivar NanYu (flowering stage, budding, and tuber swelling stages) and (b) from August to October in 2012. Concentrations were in mg/g dry weight of leaves. Values are expressed as mean ± SD of triplicate measurements; columns with the same letters are not significantly different according to Duncan's test (P ≤ 0.05).
