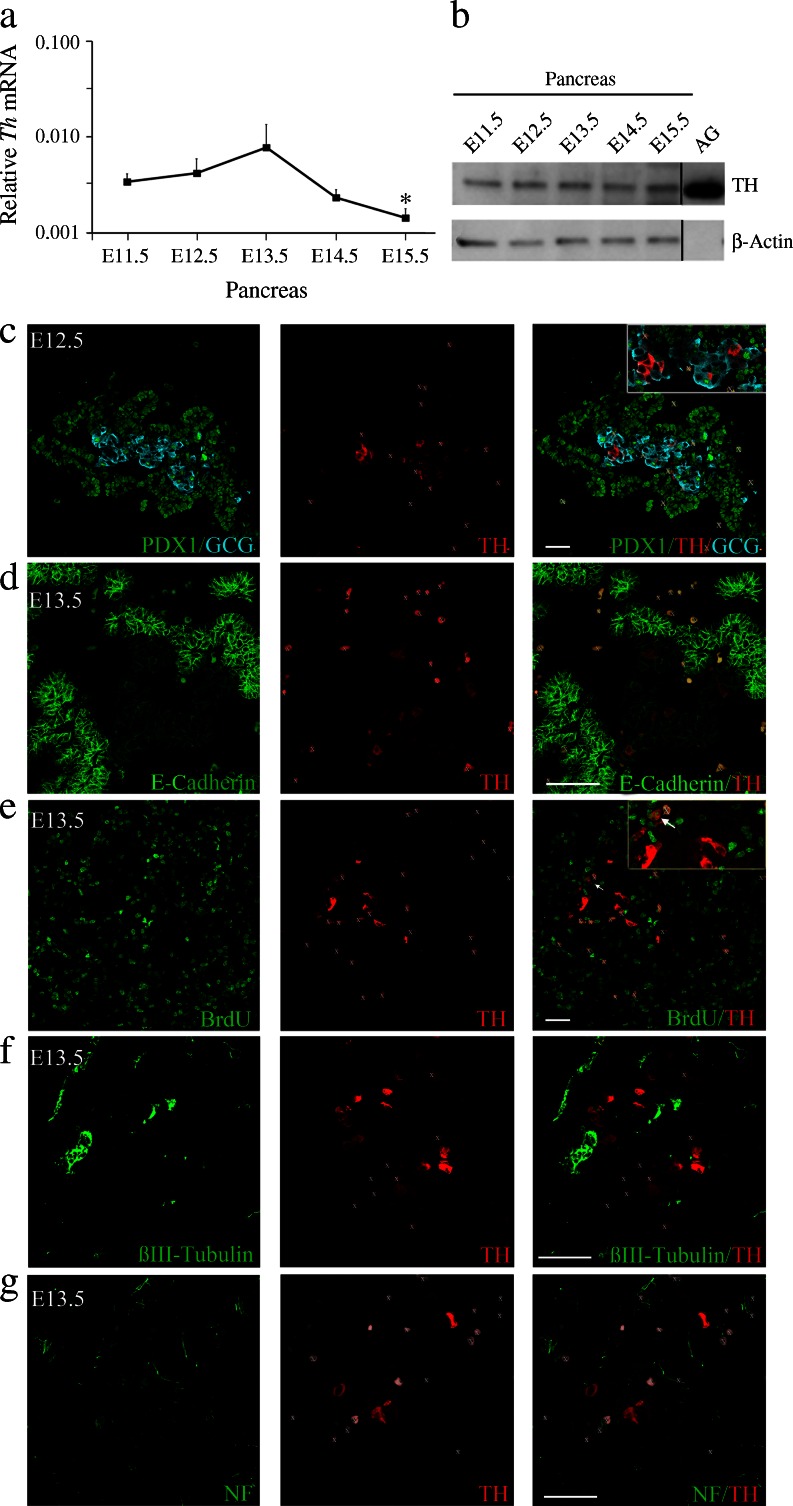
Fig. 1.
TH is expressed during early pancreas development in mice. (a) Quantitative real-time PCR of three to five pooled embryonic pancreases (E11.5 to E15.5). Levels of Th transcripts were normalised to 18S rRNA levels and the data are presented on a logarithmic scale. Results represent the mean ± SEM of at least three different pools for each embryonic stage. *p < 0.05 vs E11.5. (b) TH immunoblot of protein extracts from four pooled pancreases (E11.5 to E15.5). Adult adrenal gland (AG) extract was included as a positive control and β-actin as a loading control. As TH is highly expressed in AG, only low amounts of AG protein were loaded, so AG β-actin was not detected. The blot is representative of three independent experiments. (c–g) Embryonic pancreatic sections. (c) Co-immunostaining for PDX1 (green), TH-rabbit (red) and glucagon (GCG, cyan). (d) Double immunostaining for E-cadherin (green) and TH-rabbit (red). (e) Double-immunostaining for BrdU (green) and TH-rabbit (red). Arrows indicate double-positive cells. (f) Double immunostaining for βIII-tubulin (green) and TH-mouse (red). (g) Double-immunostaining for neurofilament (NF, green) and TH-rabbit (red). White X indicates blood cells. Scale bar, 50 μm

