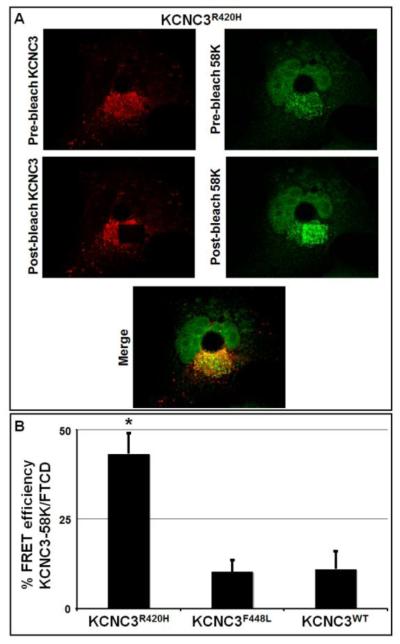
Figure 5. KCNC3R420H co-localizes with the Golgi marker 58K/FTCD by acceptor photobleaching FRET (apFRET).
COS-1 cells were transiently transfected with KCNC3WT, KCNC3F448L, or KCNC3R420H. KCNC3 protein was visualized using an antibody conjugated with rhodamine as the acceptor fluorophore, while the 58K/FTCD protein was visualized similarly with FITC. Cells were then analyzed by apFRET. (A) Representative pre-bleach and post-bleach images for KCNC3R420H transfected cells are provided. Images were obtained by laser excitation at 488 nm (FITC) or 543 nm (rhodamine). Acceptor bleaching was performed within a region of interest by repeated pulses at 543 nm. (B) Quantitative results are presented as % FRET efficiency as described in the Materials and Methods. Data are presented as mean ± SEM (KCNC3R420H, n=9; KCNC3WT, n=8; KCNC3F448L, n=6) and * denotes a p = 0.05 of KCNC3R420H level as compared to KCNC3WT.

