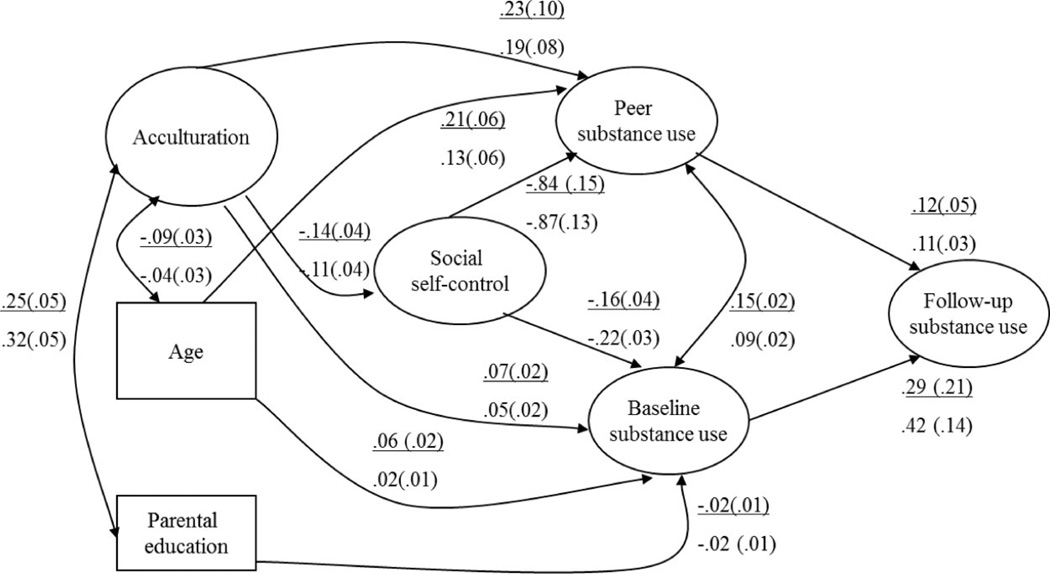
Figure 2.
Multiple-group analysis across gender (n Boys = 503; n Girls = 537). Straight arrows indicate regression paths and double-headed curved arrows indicate covariances. Values represent unstandardized coefficients (standard errors in parentheses) for boys (above) and girls (below). Only the paths or covariances that were statistically significant (p < .05) are included in the figure. None of the coefficients differed statistically significantly between boys and girls, p > .05. Residual variances for all endogenous variables, including factor indicators, were estimated but are not shown in the figure for clarity of presentation.

