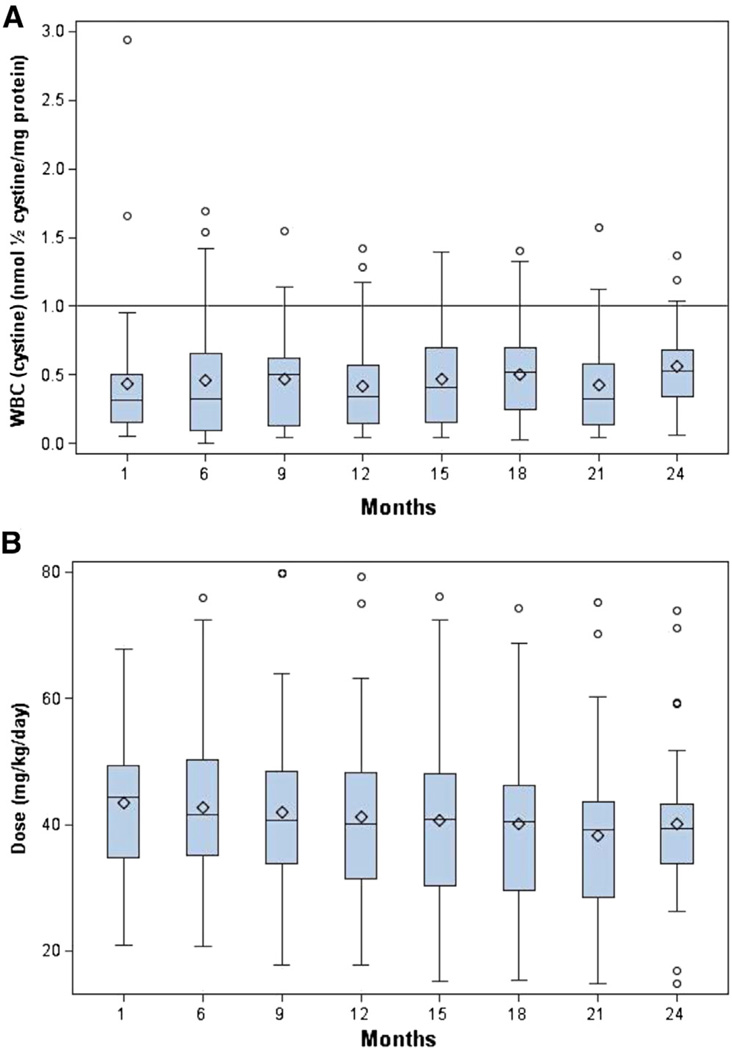
Figure 1.
A, Mean WBC (cystine) remained below 1 nmol ½ cystine/mg protein during the entire study. The solid line denotes the optimal upper level of WBC (cystine) to be achieved during substrate reduction therapy with cysteamine. There was no significant change in the WBC (cystine) over the 24-month study. B, The total daily dose (mg/kg/day) of DR-CYS in the study population over the study was reduced significantly. The box plots below show the median (−), mean (♦), and the first and third quartiles denoted by the upper and lower ends of the box, respectively. The lower and upper whiskers denote the minimum and maximum, respectively, and the (○) represent the outliers. The mean dose was reduced from 43.5 to 40.1 mg/kg/d, P = .05, during the 24-month study.

