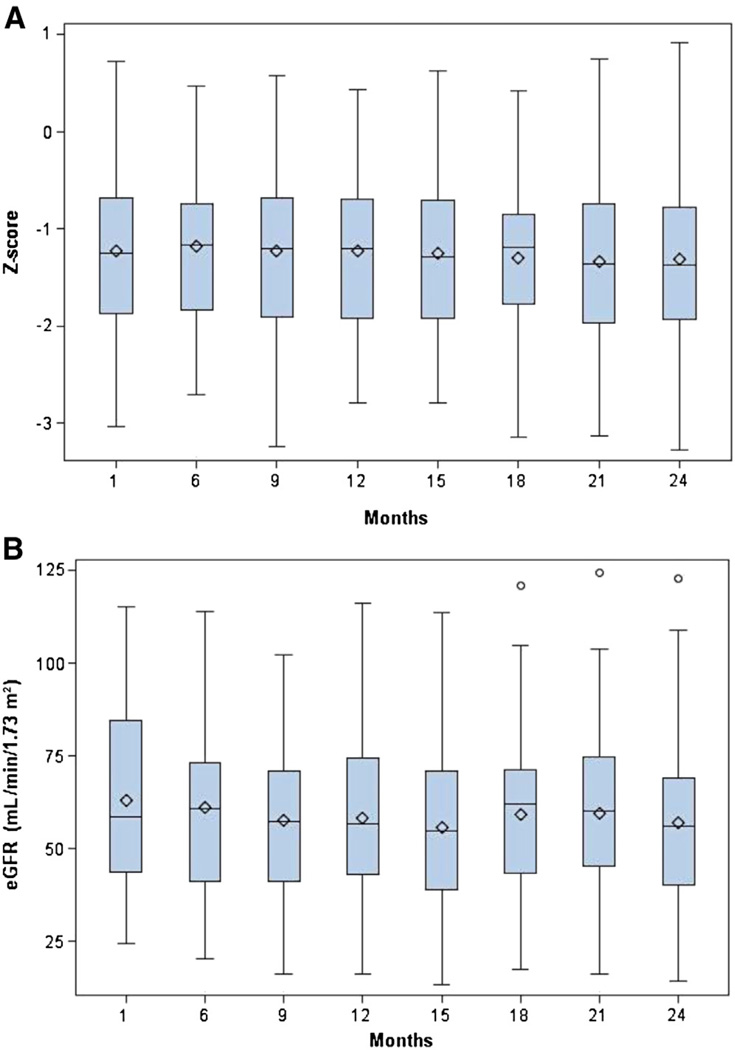
Figure 3.
A, Evolution of height (Z-score) over the 24-month study. There was no significant change in height Z-socre during the 24-month study. B, The eGFR of the study population over time. The box plots below show the median (−), mean (♦), and the first and third quartiles denoted by the upper and lower ends of the box, respectively. The lower and upper whiskers denote the minimum and maximum, respectively, and the (○) represent the outliers. The mean eGFR did not decline significantly during the course of the 24-month study.

