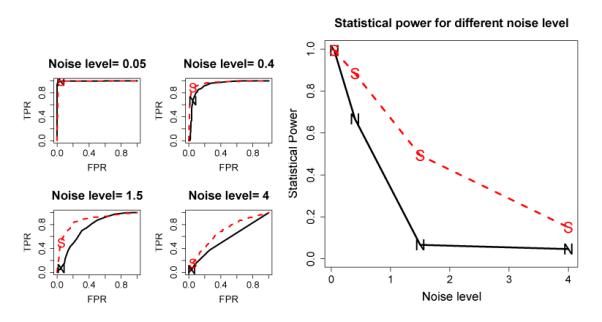
Figure 2.

ROC and power advantage of the SC over the NC method under various noise levels. Left: ROC curves under four noise levels; Right: Power as a function of noise level. Solid curves marked by “N” represent NC, while the dashed ones marked by “S” represent SC. The noise level shown is the standard deviation of the noise.
