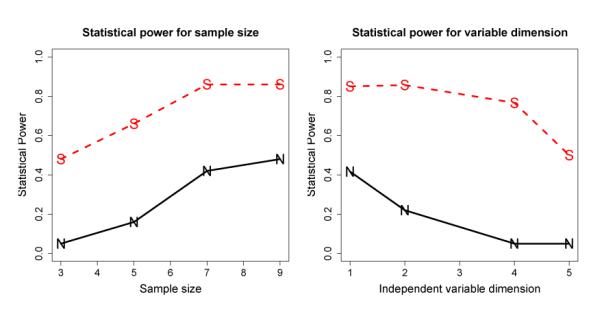
Figure 3.

Power advantage of the SC over the NC method under various sample size and interaction complexity. Left: Statistical Power as a function of the sample size; Right: Statistical Power as a function of independent variable dimension. The solid curves marked by “N” represent NC, while the dashed ones marked by “S” represent SC.
