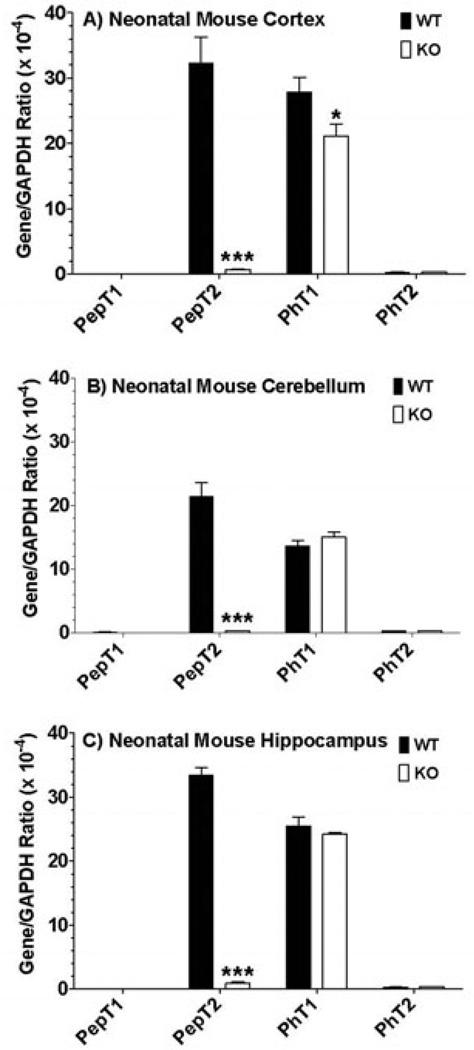
Figure 5.
Real-time PCR of POT transcripts in the cerebral cortex (A), cerebellum (B) and hippocampus (C) of neonatal wildtype (WT) and PepT2 null (KO) mouse brain. Data are reported as the ratio to GAPDH determined in each sample. Values are mean ± SE (n=3). *p ≤ 0.05 and ***p ≤ 0.001 as compared to WT mice.

