
Figure 9.
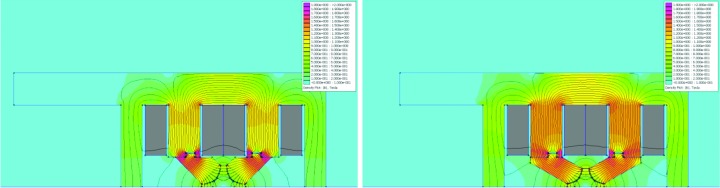
2D simulation results: field distribution in QFend and QF magnet cross sections. The colour scale goes from 0 to 2 T. The coil cross section is marked grey. Left: QFend at NI = 2273.7 A, with B′ = −33.7908 T m−1. The field is highest around the pole tip/pole root mating surface, ∼1.5 T. There is also local saturation of ∼1.8 T at the guiding slot. Right: QF at NI = 3010.8 A, with B′ = −41.9869 T m−1. The field is ∼1.3–1.5 T throughout the pole tip and pole root, with local saturation of ∼1.8 T at the guiding slot.