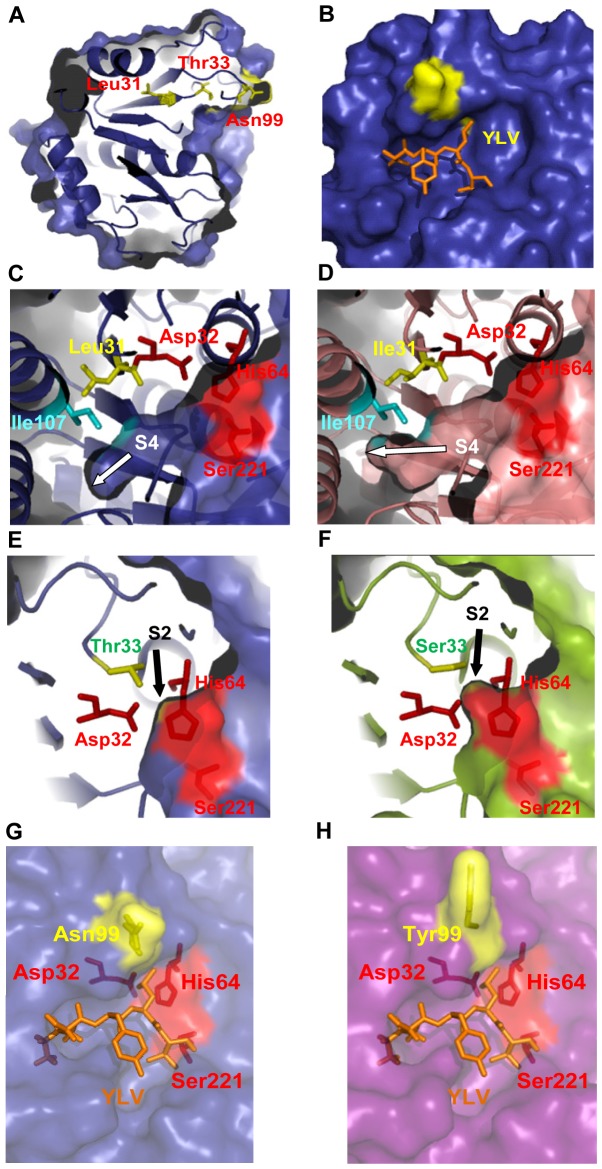
Figure 4. Structural interpretation.
(A) SAPB model showing the positions of the mutated amino-acids. (B) Surface representation of SAPB which the YLV tripeptide synthetic substrate, shown in orange sticks, has docked. Close up views of (C) the catalytic cavity and Leu31, showing a superposition of surface and ribbon representations of the SAPB model, (D) the catalytic cavity and the Ile31 residue in the SAPB-L31I model. (E) Thr33 in the SAPB model showing a superposition of surface and ribbon representations, and (F) Ser33 in the SAPB-T33S model showing a superposition of surface and ribbon representations. (G) Asn99 in the SAPB model showing a superposition of surface and ribbon representations, and (H) Tyr99 in the SAPB-N99Y model showing a superposition of surface and ribbon representations. The mutated residues are shown in yellow sticks and surfaces. These figures were prepared using the PyMol software (http://www.pymol.org).

