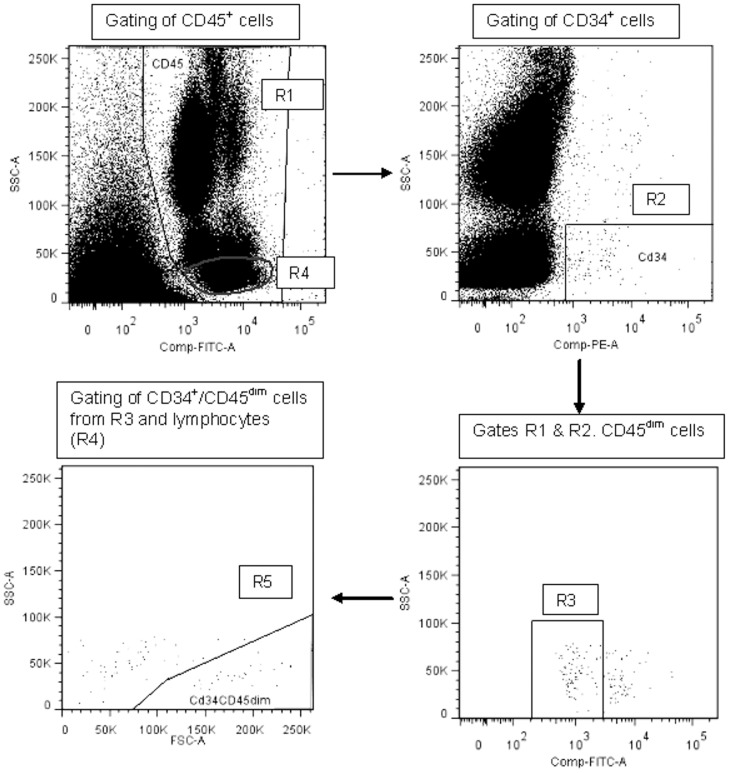
Figure 1. Enumeration of CACs.
ISHAGE gating strategy for CAC enumeration. Cells positive for CD45 and therefore leukocytes were gated in R1. Cells in R1 that were positive for CD34 and had low side scatter characteristics were plotted in R2 and defined as CD34+ cells. Cells from R2 were gated on a further plot to determine the CD45dim population. Subsequently cells from R3 were back-gated from R4 and gated on a further plot (R5) to define CD34+CD45dim cells that are located within the lymphocyte population.

