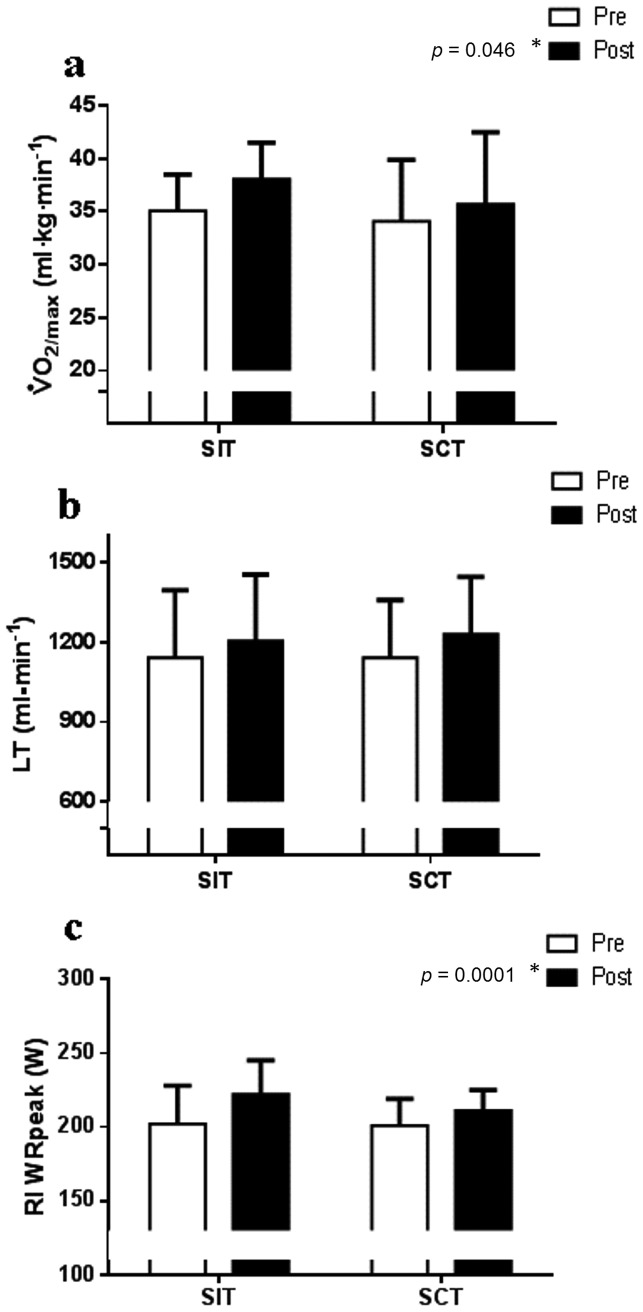
Figure 2. Cardio-respiratory fitness.
* indicates a significant pre to post-training difference in both groups (time effect p<0.05). a) Relative maximal oxygen uptake ( ) increased following both SIT (n = 6) and SCT (n = 6; main time effect p = 0.046) with no group x time interaction (p = 0.49). b) The estimated lactate threshold (LT) followed a trend to increase in both training groups (main time effect p = 0.08) with no group x time interaction (p = 0.30). c) The ramp incremental (RI) test work-rate peak (WRpeak) significantly increased in both groups (main time effect p = 0.0001) with a greater increase following SIT (group x time interaction p = 0.05).

