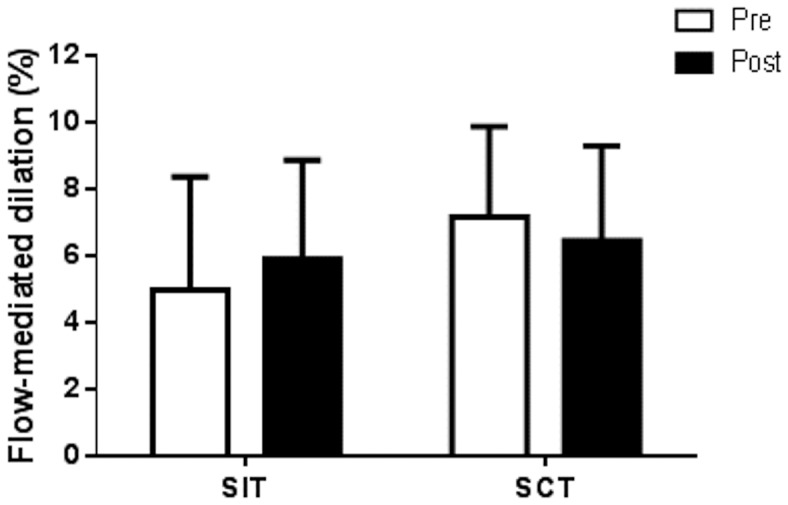
Figure 3. Brachial artery endothelial function.

Brachial artery FMD displayed a trend for an increase following SIT (n = 6) but no change following SCT (n = 6; main time effect p = 0.81; group x time interaction p = 0.08).

Brachial artery FMD displayed a trend for an increase following SIT (n = 6) but no change following SCT (n = 6; main time effect p = 0.81; group x time interaction p = 0.08).