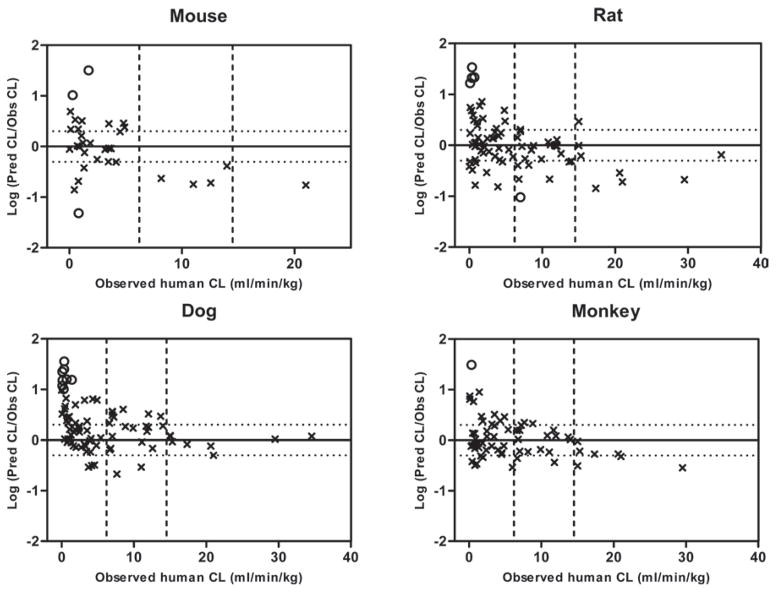
Figure 2.
Correlation between the prediction accuracy [ratio of predicted/observed (Pred/Obs)] and the observed value of human clearance (CL) for small-molecule drugs using single species allometric scaling with fixed exponent of 0.65 (the average optimal value from Figure 1). The solid horizontal line represents the identity with Pred/Obs ratio = 1 and the upper and lower dotted horizontal lines represent 2-fold above and 2-fold below the identity, respectively. Several outliers with prediction error of greater than 10 were denoted as open circles. The two dotted vertical lines represent the criteria dividing small-molecules with low (hepatic extraction ratio < 0.3), medium, and high (hepatic extraction ratio > 0.7) clearance drugs.

