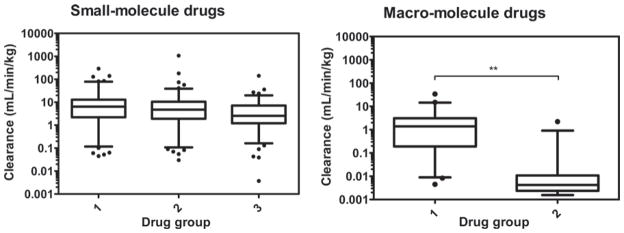
Figure 4.

Relationship between human clearance and molecular weight for small- and macro-molecule drugs. Whiskers of box and whiskers plots represent the 5–95th percentile of data. For small-molecules: group1, MW < 300 Da (n = 233); group 2, 300 ≤ MW < 400 Da (n = 221); group 3, 400 ≤ MW (n = 221). For macro-molecules: group 1, MW < 69 kDa (n = 49) and group 2 (n = 29), MW ≥ 69 kDa (**p < 0.01 as determined by t-test).
