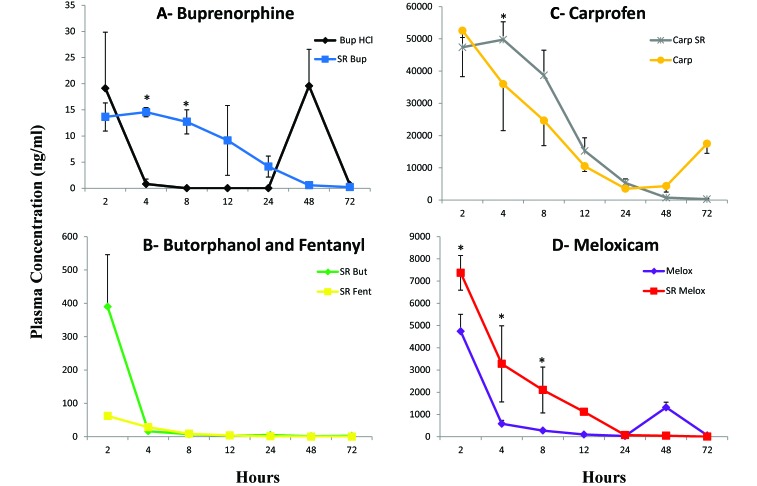
Figure 1.
Plasma concentrations of analgesics over time. Three mice were sampled at each time point for the first 72 h, except for Bup-SR (4 mice sampled at 48 h; 5 mice sampled at 72 h). NonSR formulations were analyzed at 12 h after administration, representing the nadir plasma levels. Bars represent 1 SD; *, significant (P < 0.05) difference between the SR formulation and the nonSR formulation at that given time point prior to the redosing interval. (A) Bup-SR and Bup-HCl. (B) Butp-SR and Fent-SR. (C) Carp-SR and Carp. (D) Melox-SR and Melox.

