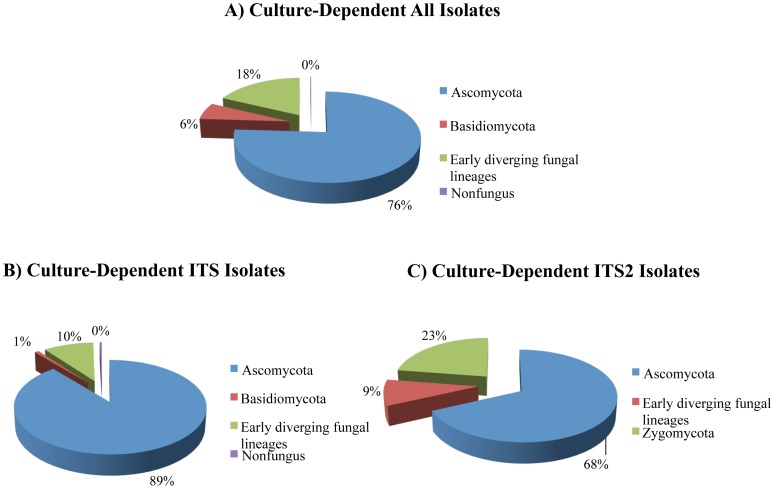
Figure 1. Fungal isolates recovered by culture-dependent methods.
(A) Relative distribution of all cultures according to different fungal phyla; (B) Relative distribution of isolates identified by homologies to ITS sequences; (C) Relative distribution of isolates identified by homologies to ITS2 sequences. The zero percent assigned in pie chart represents isolates with less than 1% relative distribution.

