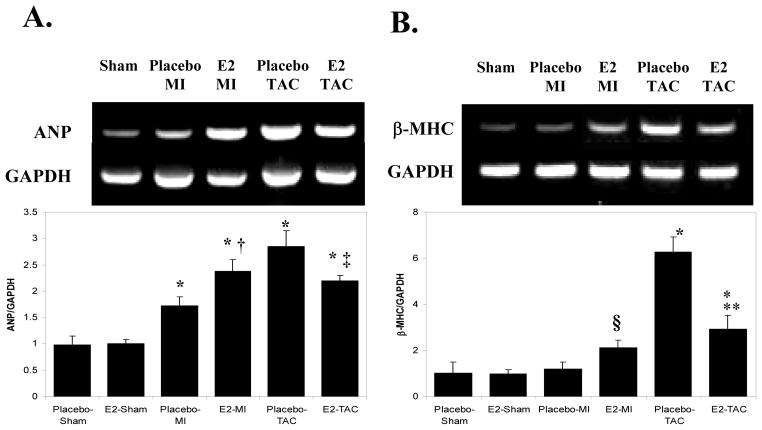
Figure 2. Gene Expression Markers of Myocyte Hypertrophy 2 weeks following MI vs. TAC.
A. ANP Gene Expression. Measured semi-quantitatively using multiplex rtPCR, simultaneously measuring GAPDH and ANP. The figure represents an example of an ethidium bromide-stained agarose gel from which ANP gene expression (above) was quantified by densitometry, correcting for GAPDH levels (below). B. β-MHC Gene Expression: Measured by multiplex rtPCR as with ANP. * p<0.01 vs. the respective sham group. † p<0.05 vs. placebo-MI. ‡p<0.05 vs. placebo-TAC. ** p<0.01 vs. placebo-TAC. § p=0.09 vs. E2-Sham

