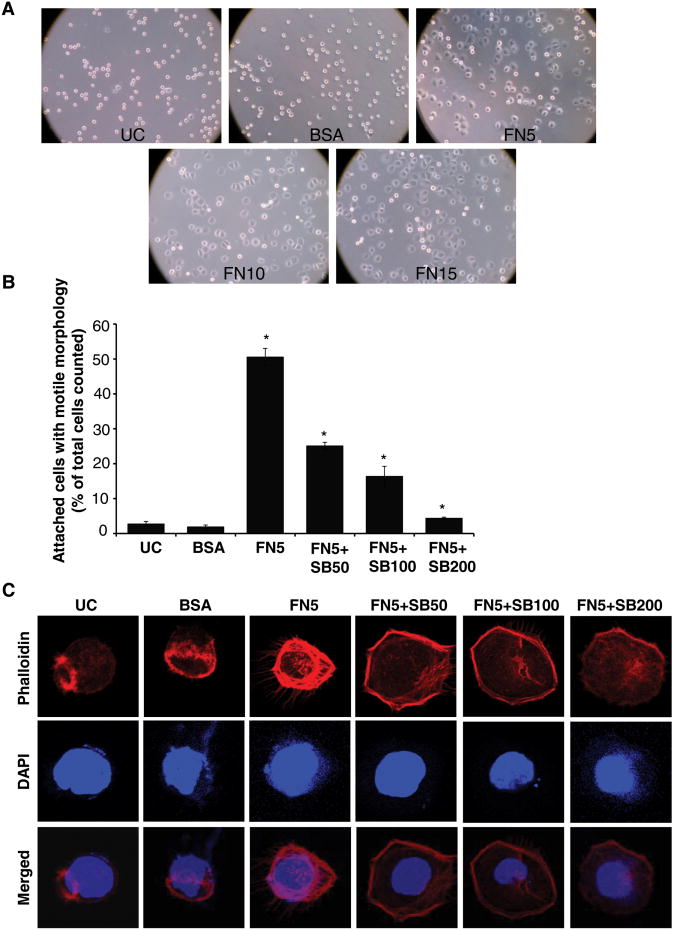
Figure 1. Silibinin inhibits fibronectin-induced motile morphology in PC3 cells.
(A) PC3 cells were plated on cell culture plates coated with different concentrations of fibronectin (5-15 μg/ml). After 1 hr, cells were examined under a light microscope (at 100× magnification). PC3 cells plated on BSA (15 μg/ml) coated or uncoated plates served as relevant controls. (B) PC3 cells (1.5 × 10⁴ per well) were plated on fibronectin coated culture plates (5 μg/ml fibronectin) along with DMSO or different concentrations of silibinin (50-200 μM). After 1 hr, attached cells with defined motile morphology were counted under a light microscope. PC3 cells plated on BSA (5 μg/ml) coated or uncoated plates served as relevant control. Data shown in bar diagram is mean±SEM of three samples. (D) PC3 cells (1.5 × 10⁴ per well) were plated on fibronectin (5 μg/ml) coated cover slips along with DMSO or different concentrations of silibinin (50-200 μM). After 1 hr, cells were fixed and analyzed for F-actin distribution through confocal microscopy detailed in ‘Materials and methods’. In confocal pictures shown (at 1500×), rhodamine-phalloidin (in red) represents cellular F-actin distribution, while DAPI (in blue) stains nuclei. Abbreviations: UC: Uncoated; BSA: Bovine serum albumin; FN: Fibronectin; SB: Silibinin. *, p≤0.001

