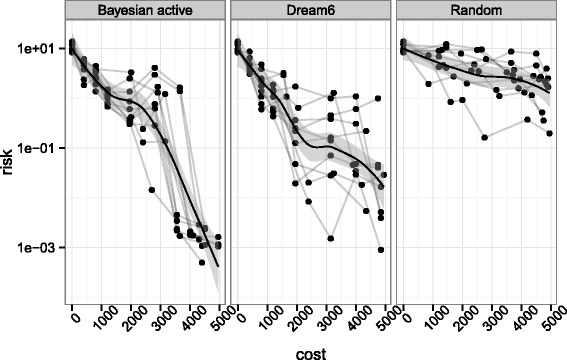
Figure 3.

Comparison of risk evolution between different strategies. Comparison of risk evolution between different strategies on a subnetwork. The figure shows the true risk at each step of the procedure, i.e. the approximate posterior distribution is compared to the true underlying parameter which is unknown during the process. The risk is computed at the center of the posterior sample. The different lines represent 10 repeats of the design procedure given the same initial credit budget and the points represent experiment purchase. The first panel represents our strategy, the second panel implements the criterion of the best performing team on DREAM6 challenge while random design consists in choosing experiments randomly.
