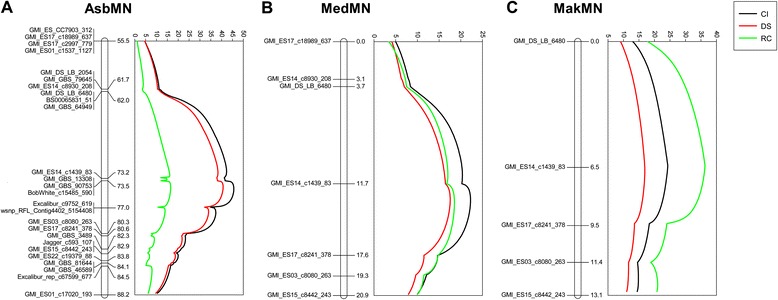
Figure 2.

Simple interval mapping (SIM) QTL scans revealing QPc.crc-14D on oat chromosome 14D. QTL analysis of APR is based upon data averaged environments for disease severity (DS), reaction class (RC), and coefficient of incidence (CI) in the mapping populations: A AC Assiniboia/MN841801 (AsbMN), B AC Medallion/MN841801 (MedMN), and C Makuru/MN841801 (MakMN).
